The number of different bacterial species and the total number of genes
| Bacteria type | Species number | Gene number |
|---|---|---|
| Extreme acidophile | 16 | 13295 |
| Moderate acidophile | 47 | 18319 |
| Mild acidophile | 97 | 20272 |
| Neutralophile | 2786 | 20794 |
| Mild alkaliphile | 396 | 20751 |
| Moderate alkaliphile | 121 | 20332 |
| Extreme alkaliphile | 13 | 14483 |
| All | 3476 | 20794 |
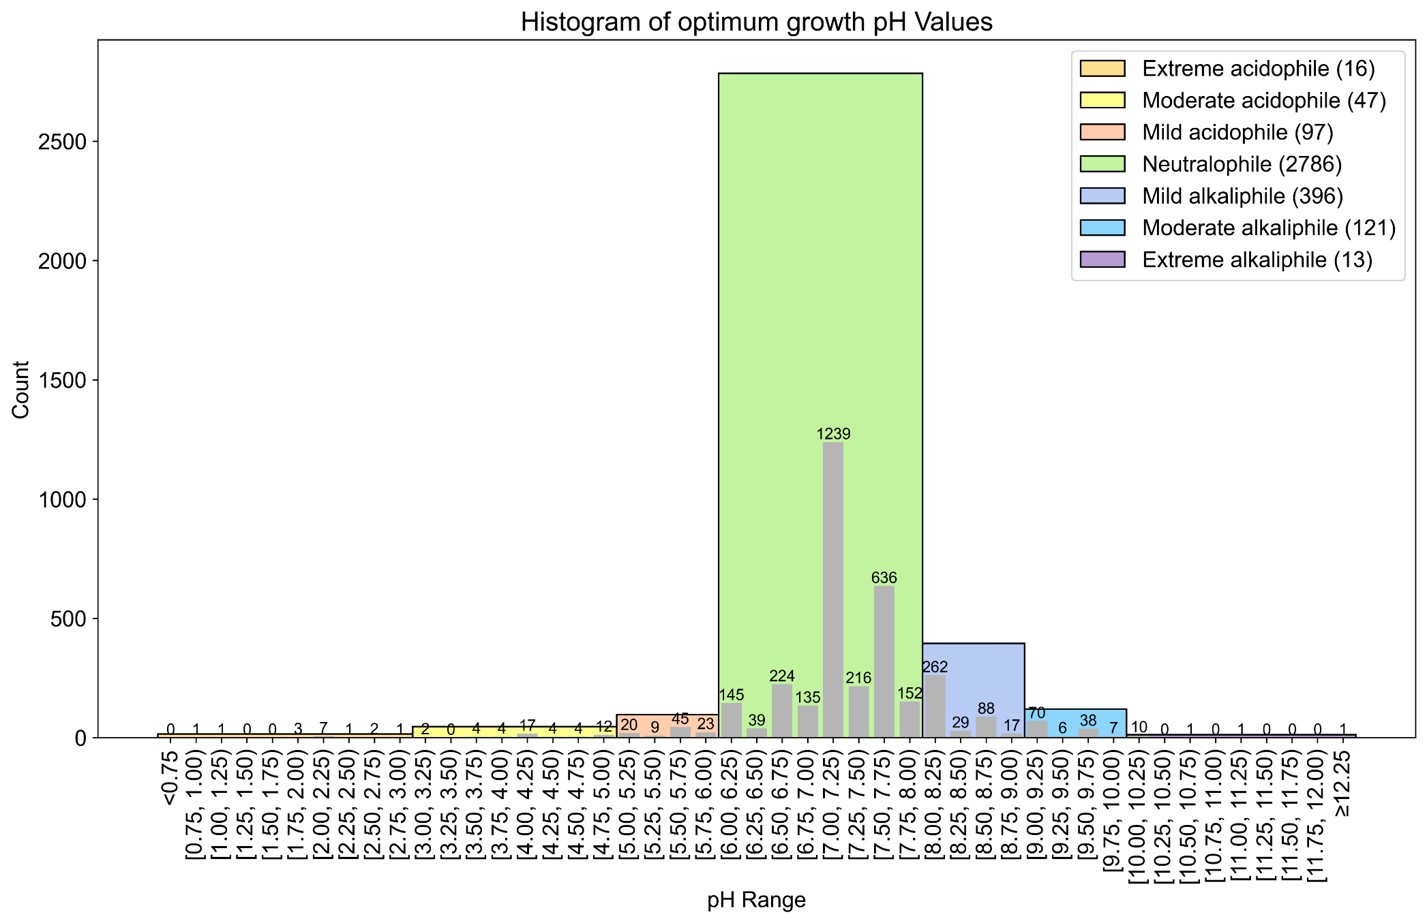
Microorganisms are classified based on their optimal growth pH ranges
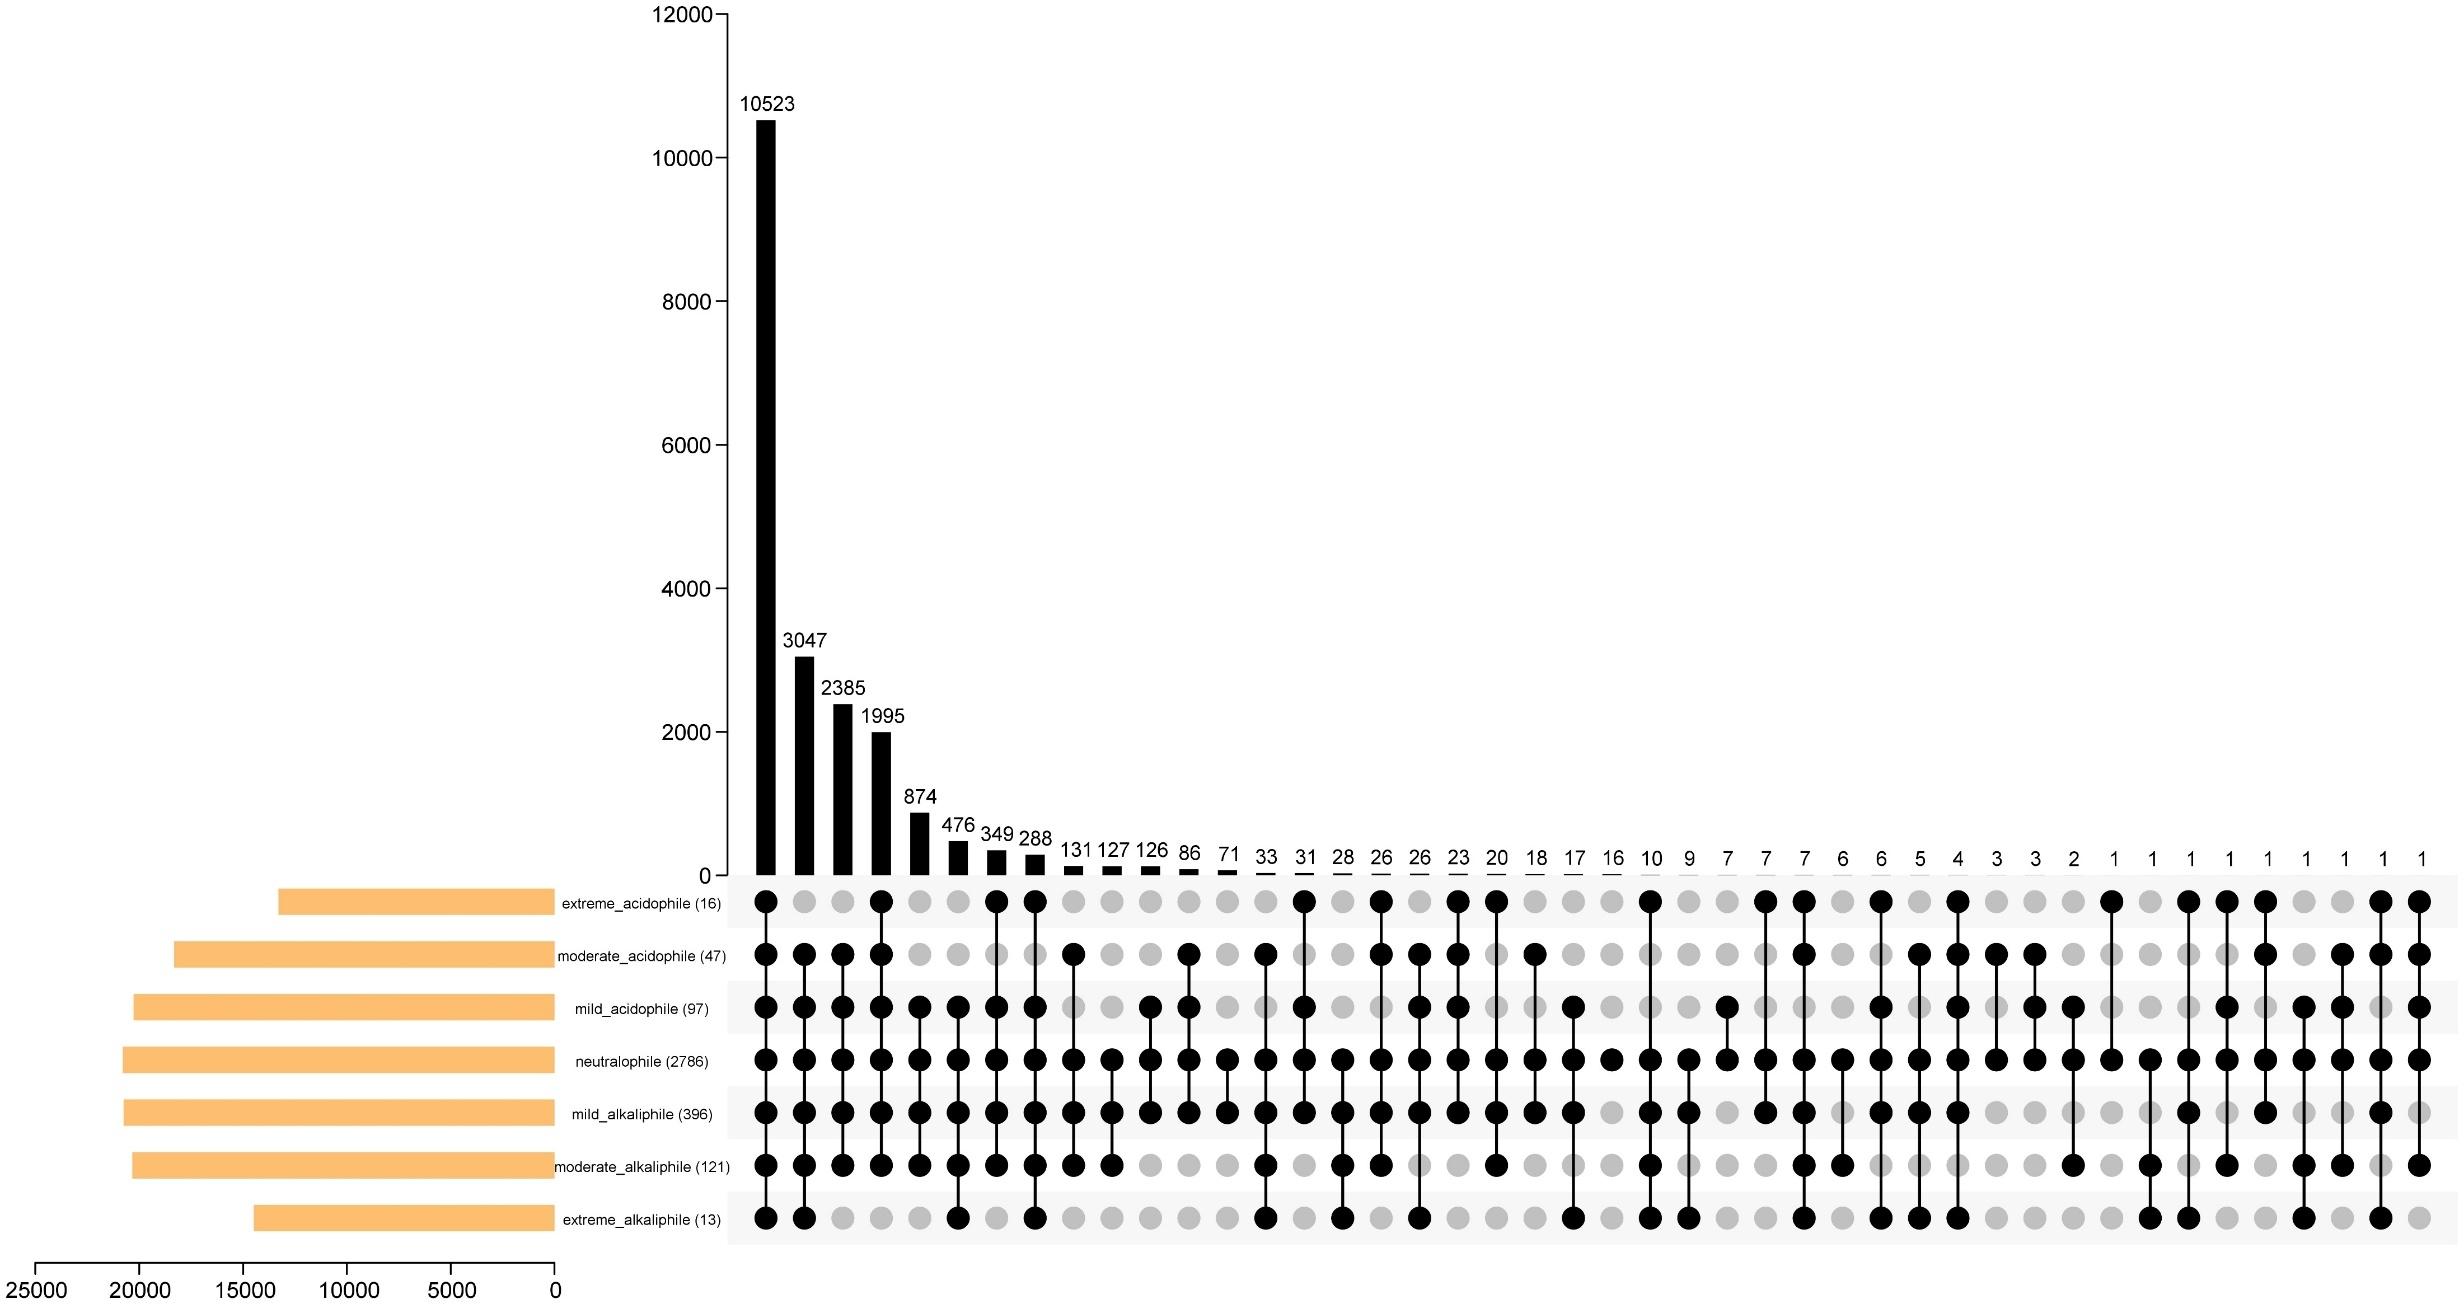
Finally, it is possible to match the quantity statistics of 3476 bacterial optimal pH value ranges representing the genome.
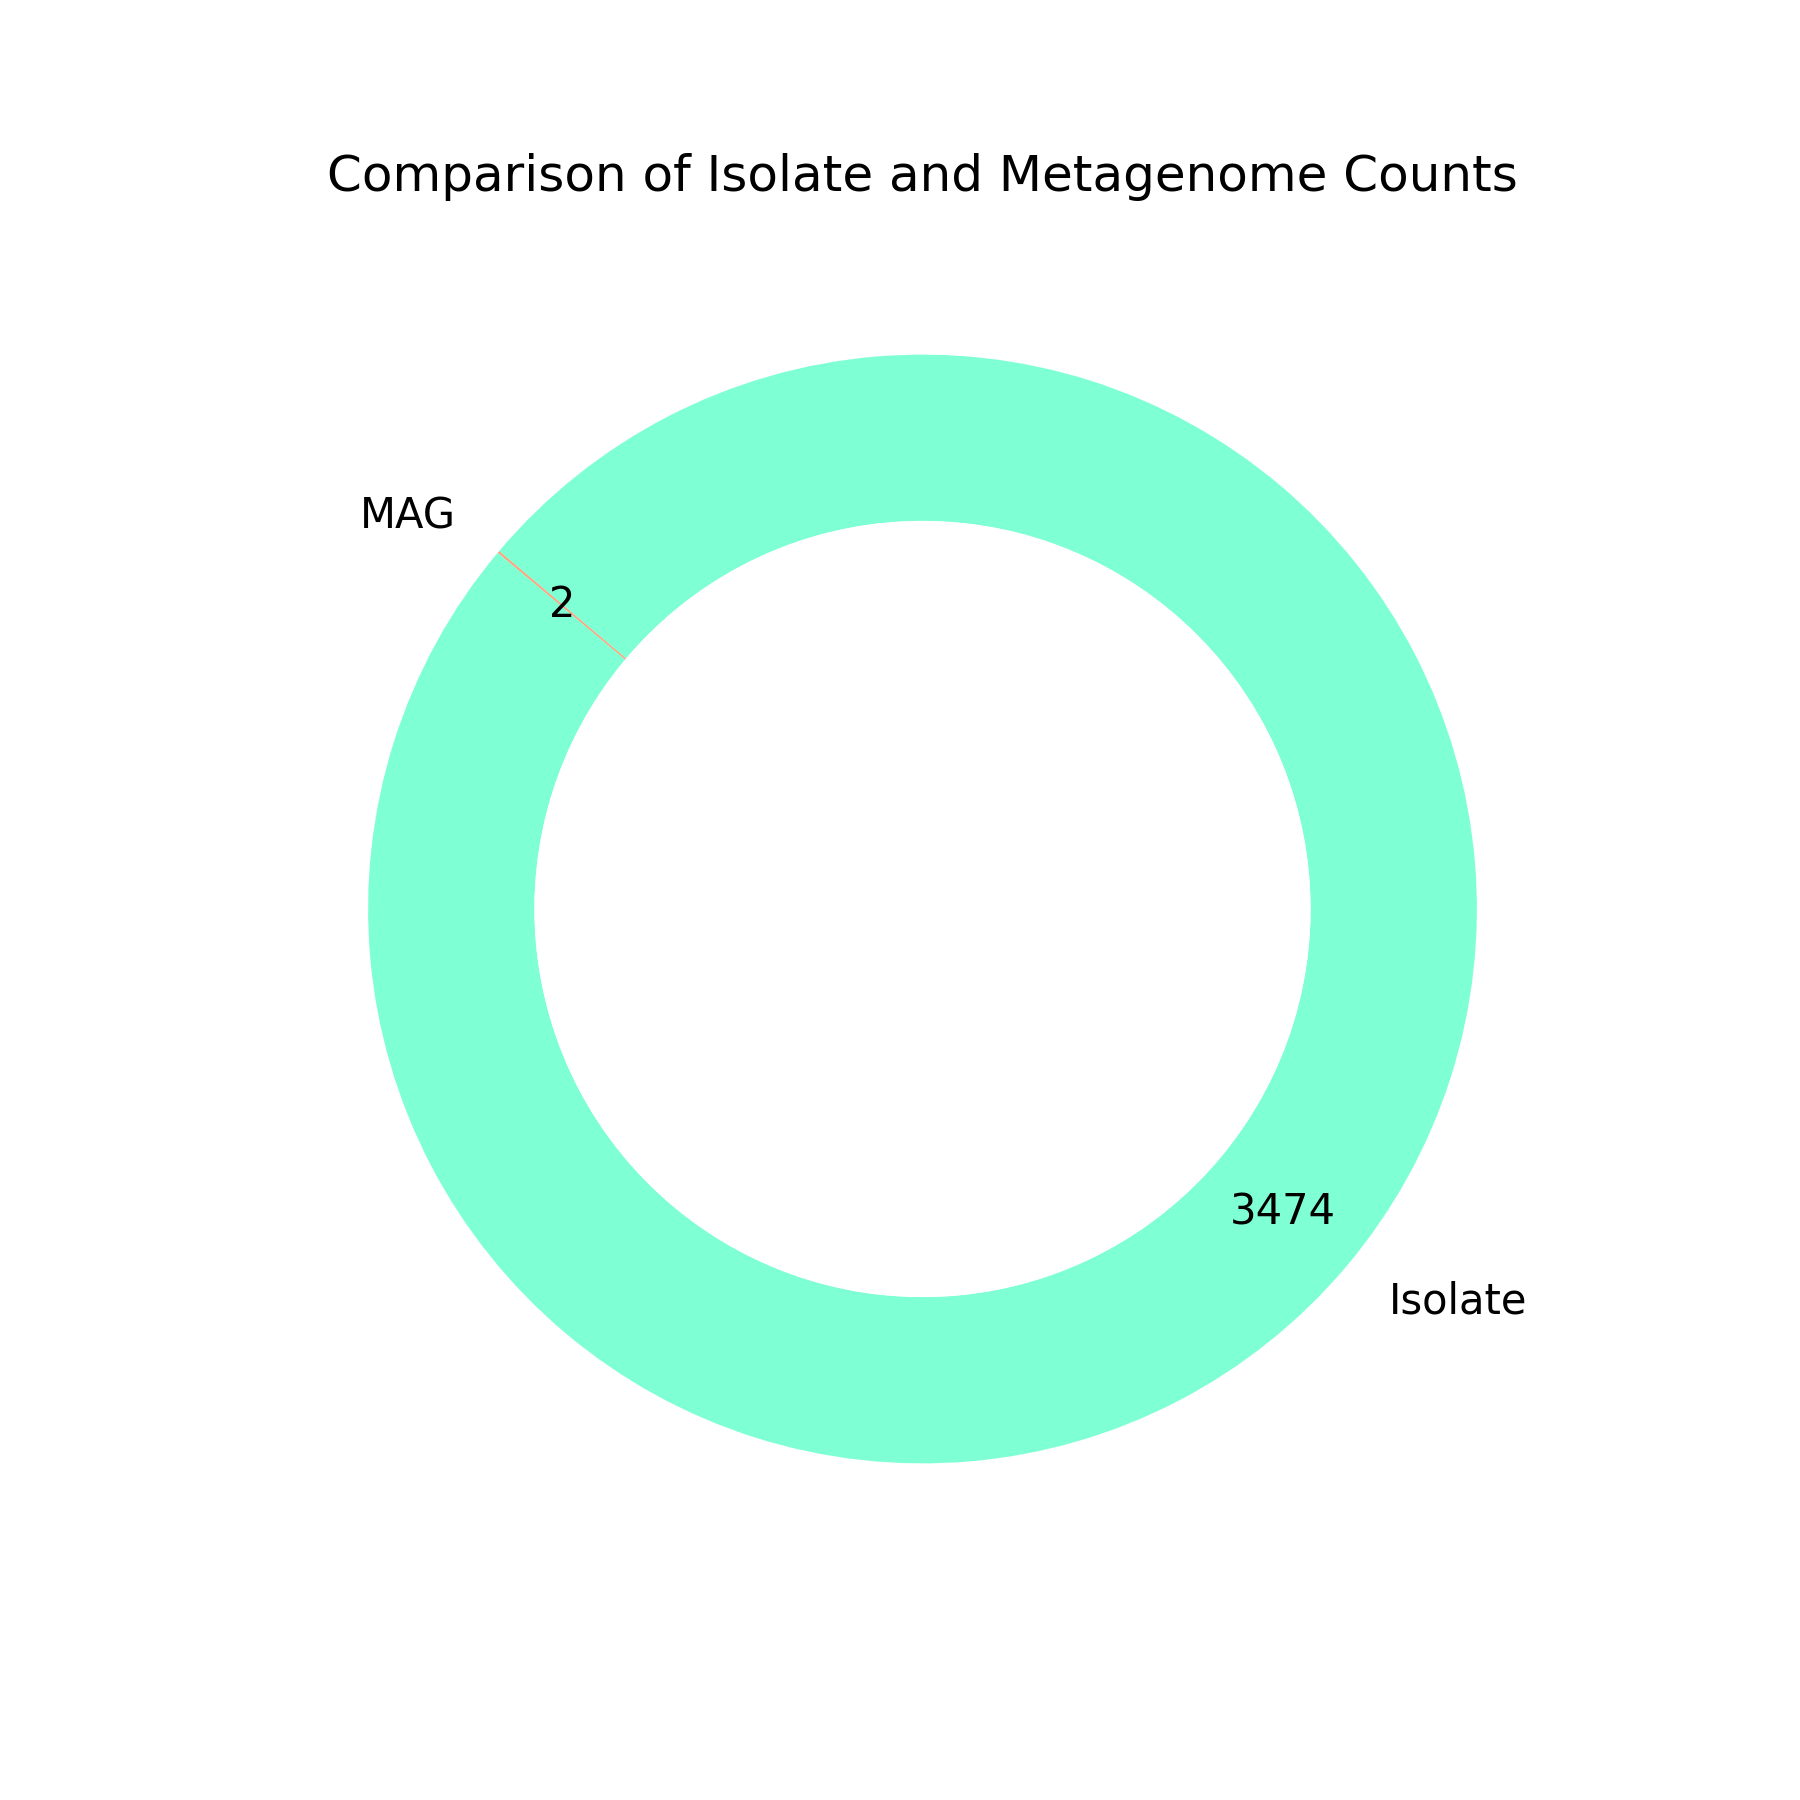
Source of representative bacterial genomes
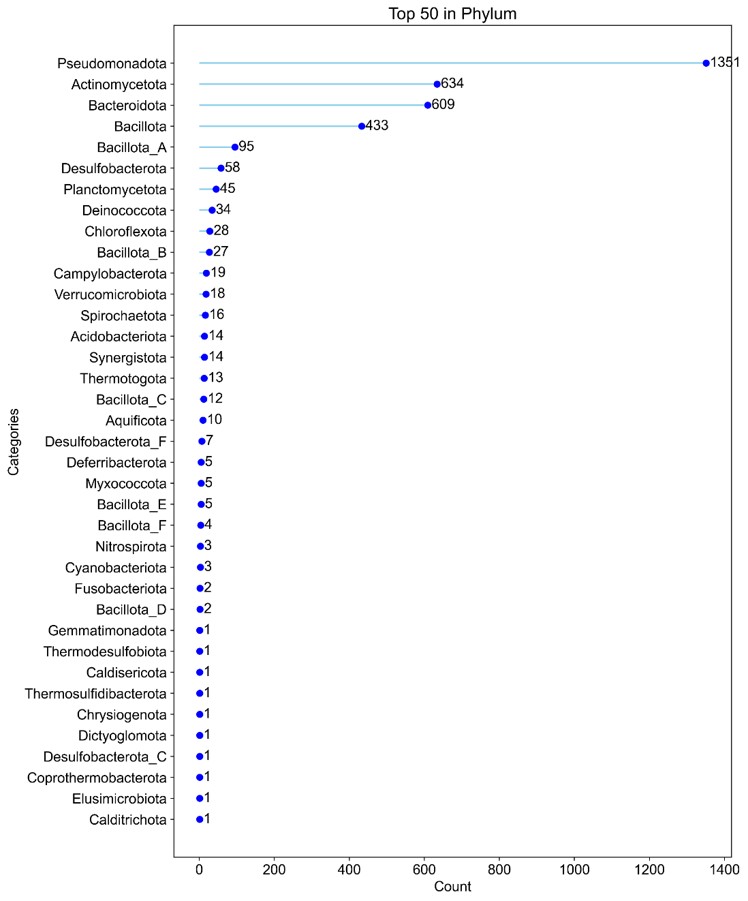
Statistics on the number of bacteria classified at the phylum level
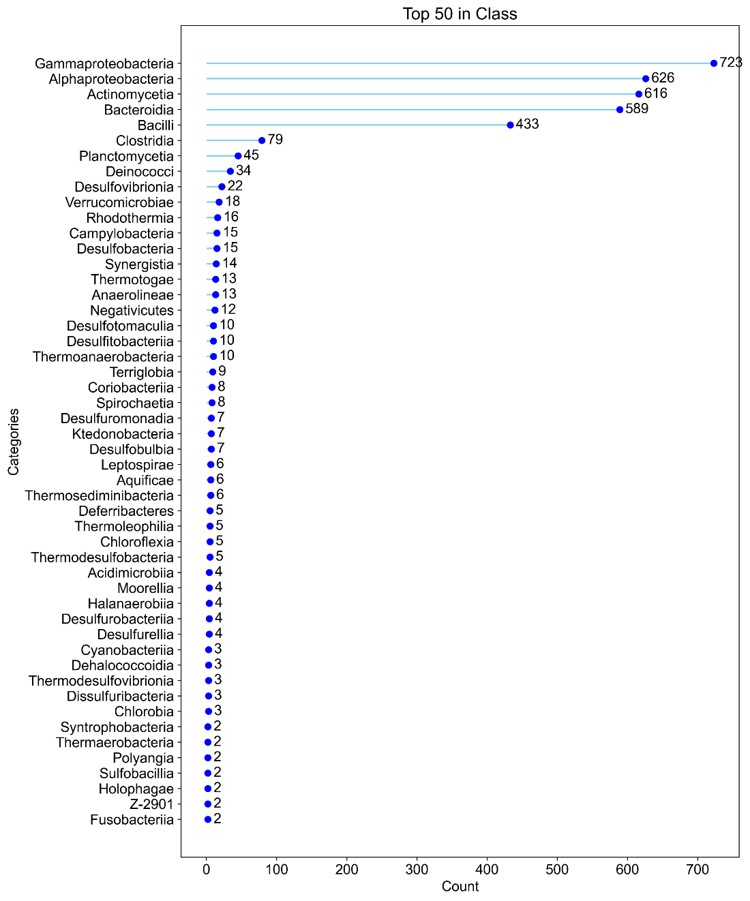
Statistics on the quantity of top 50 bacteria classified at the class level
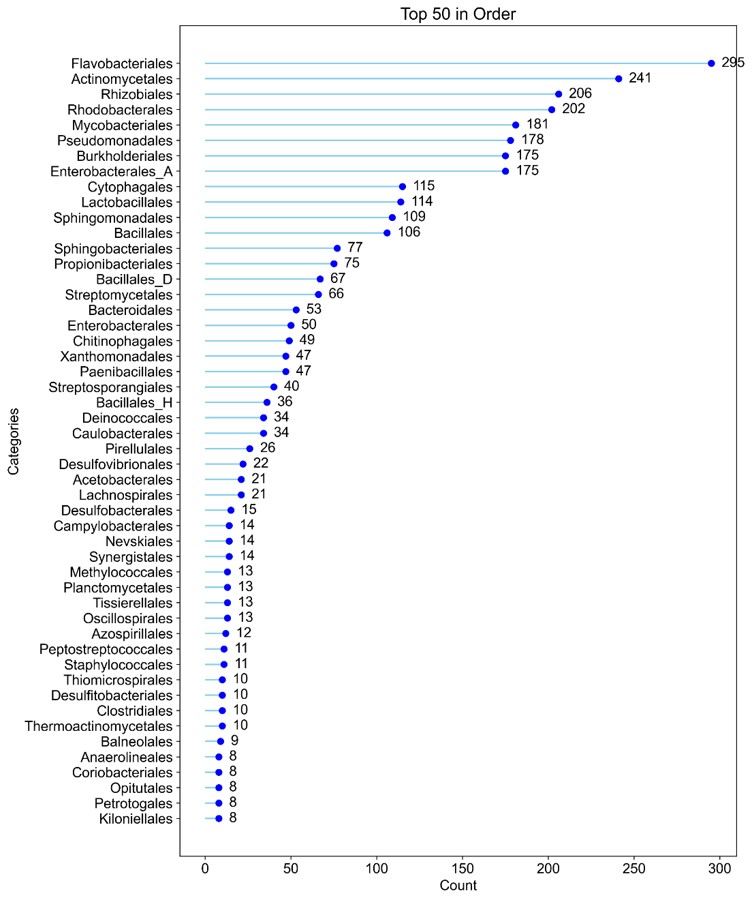
Statistics on the quantity of top 50 bacteria classified at the order level
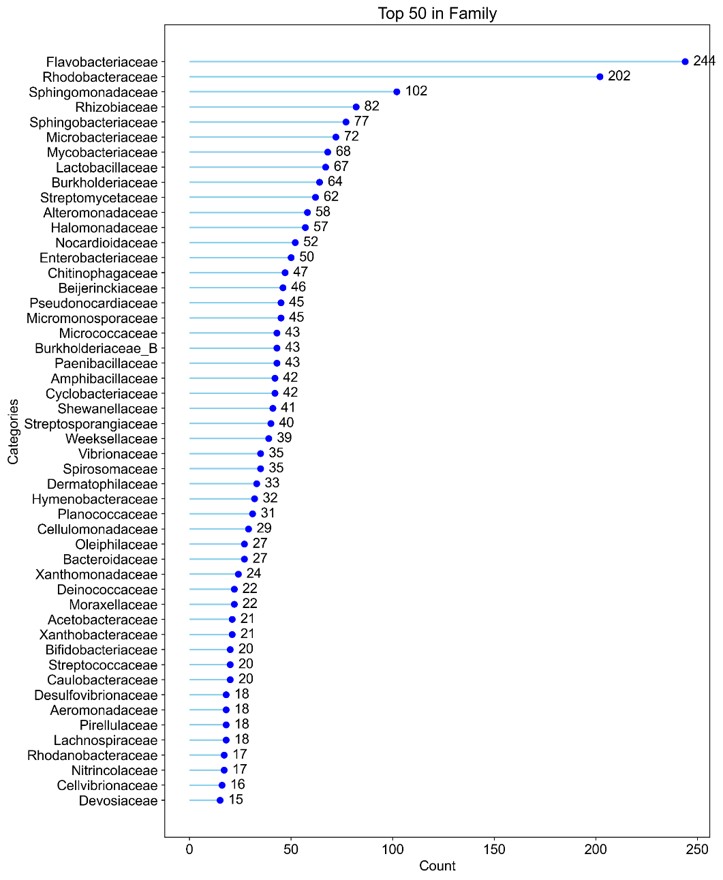
Statistics on the quantity of top 50 bacteria classified at the family level
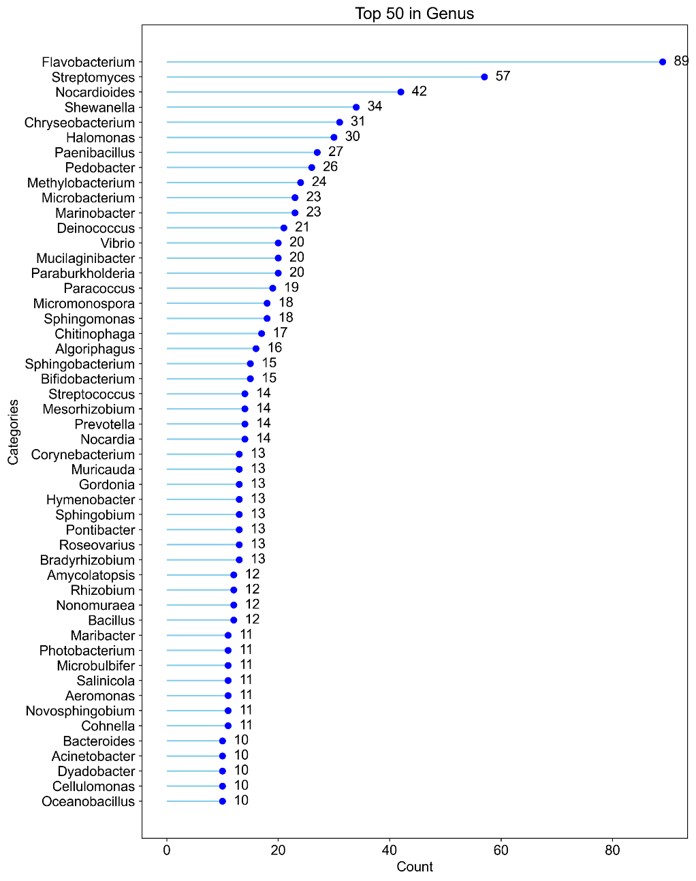
Statistics on the quantity of top 50 bacteria classified at the genus level
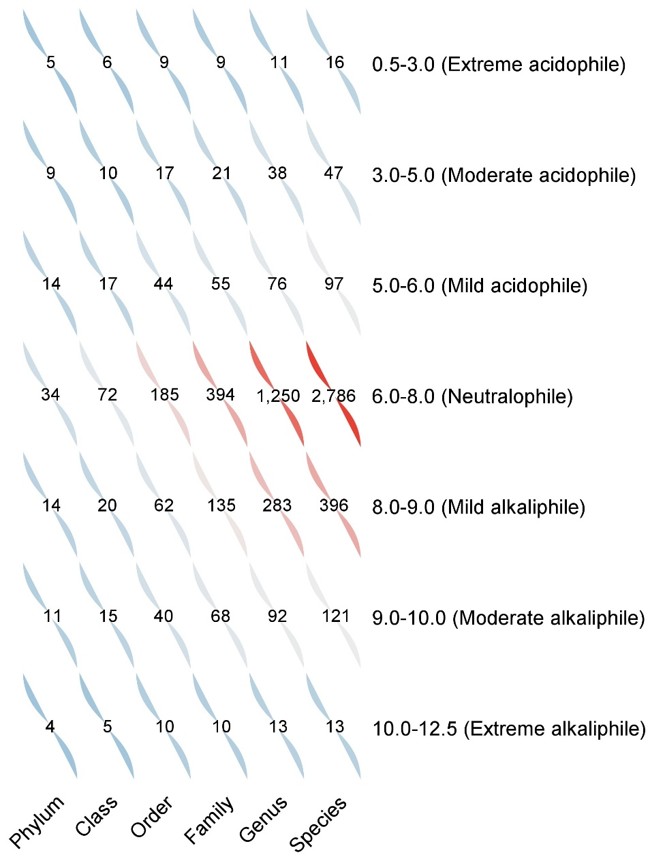
Quantity distribution of each taxonomic level across optimal growth pH intervals with 0.5 intervals
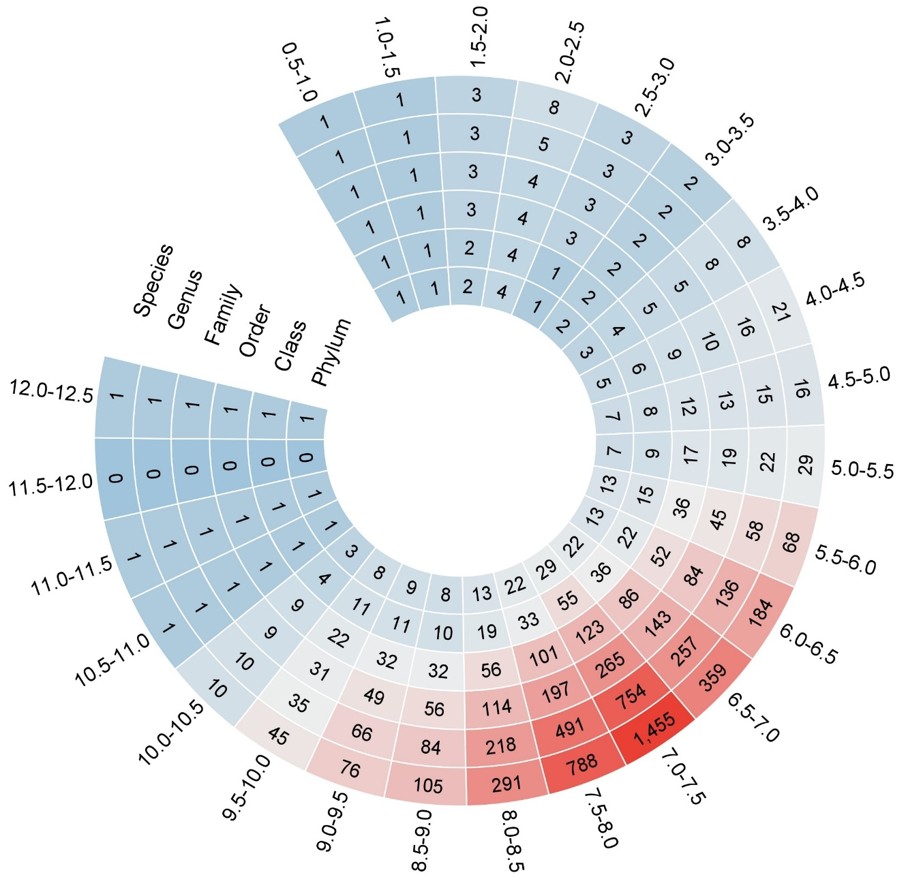
Quantity distribution of each taxonomic level across optimal growth pH intervals classified by microbial taxonomy