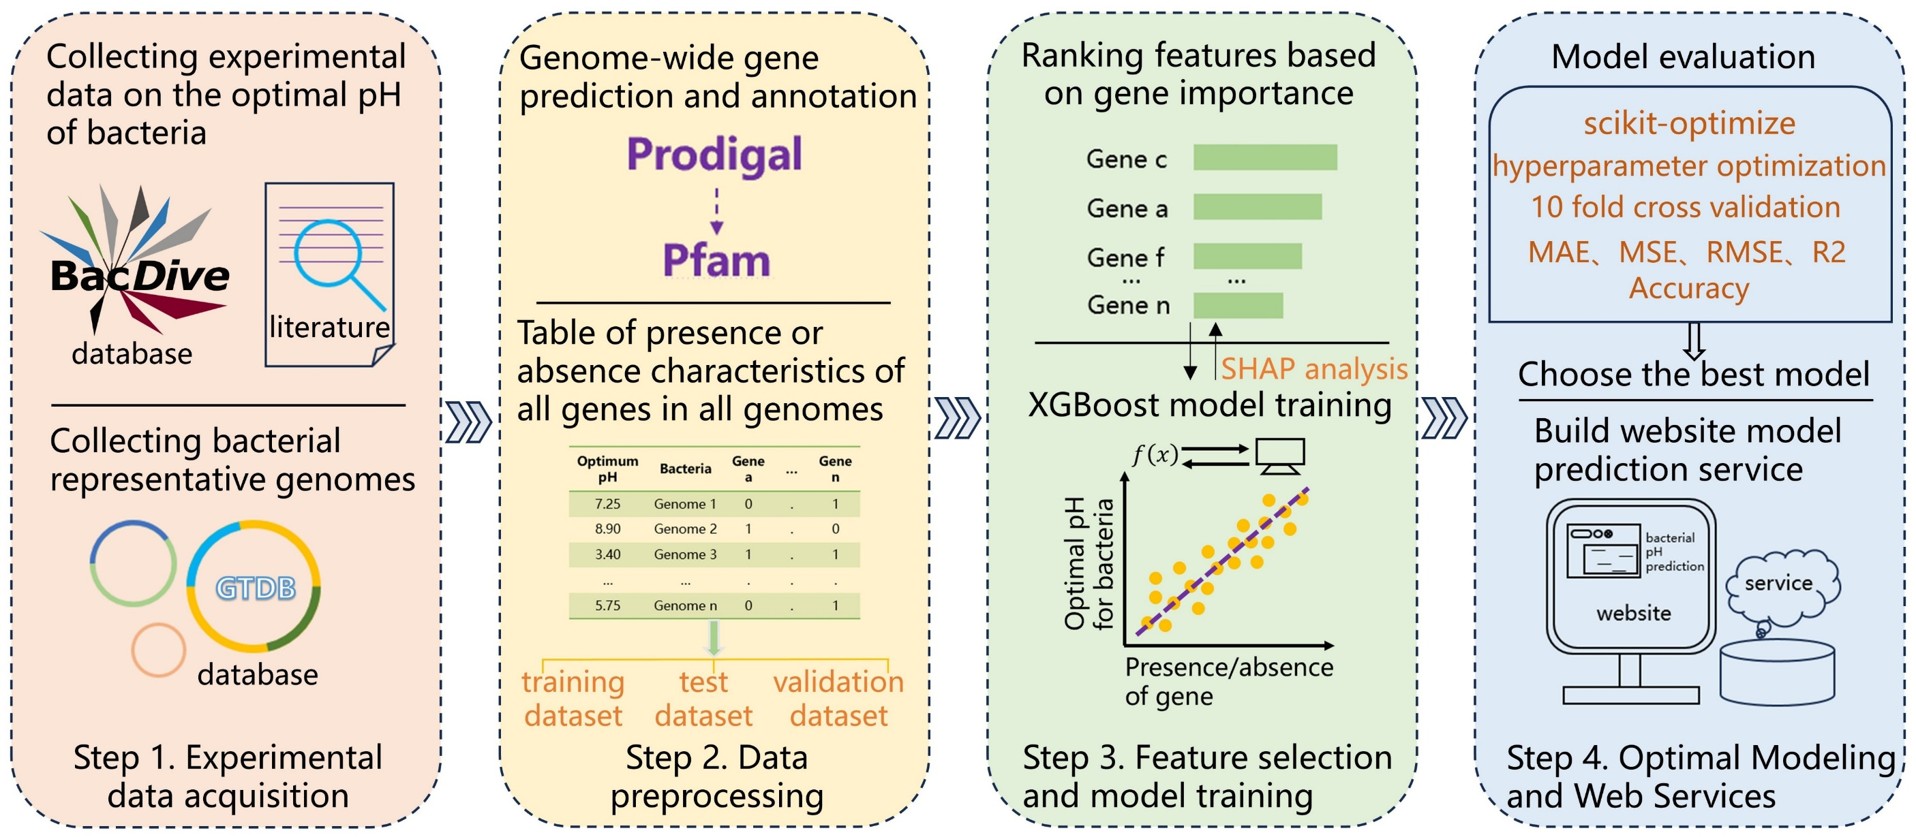
Workflow for predicting the optimal pH for bacterial growth
1. Acquisition of Bacterial Optimal Growth pH Values and Genomic Sequences Based on Big Data
Experimental data on the optimal growth pH of bacteria were retrieved from BacDive database (https://bacdive.dsmz.de/). Additionally, a large volume of experimentally determined bacterial optimal growth pH data was collected from literature databases including Google Scholar (https://scholar.google.com/) and Web of Science (https://webofscience.clarivate.cn/wos/woscc/basic-search) using keywords (e.g., "Bacteria*", "Growth", "Optim**", "pH") in English, combined with regular expression methods. Based on the Latin names of the acquired bacterial species, their genomic sequences were obtained from the GTDB (release 214) database (https://gtdb.ecogenomic.org/).
2. Acquisition of Bacterial Genomic Features Using Bioinformatics Methods
After obtaining the representative genomic sequences of all bacteria at the species level, the amino acid sequences of all genes in the bacterial genomes were predicted using Prodigal software (version 2.6.3; https://github.com/hyattpd/prodigal/wiki). Subsequently, HMMER software (version 3.3.2; http://www.hmmer.org/) was used for proteome annotation (Pfam36). This process yielded all gene types present in each bacterial genome. Python programming was then employed to consolidate the presence (coded as 1) or absence (coded as 0) of all gene types into a two-dimensional matrix table.
3. Construction of an Accurate Prediction Model Using Machine Learning Methods
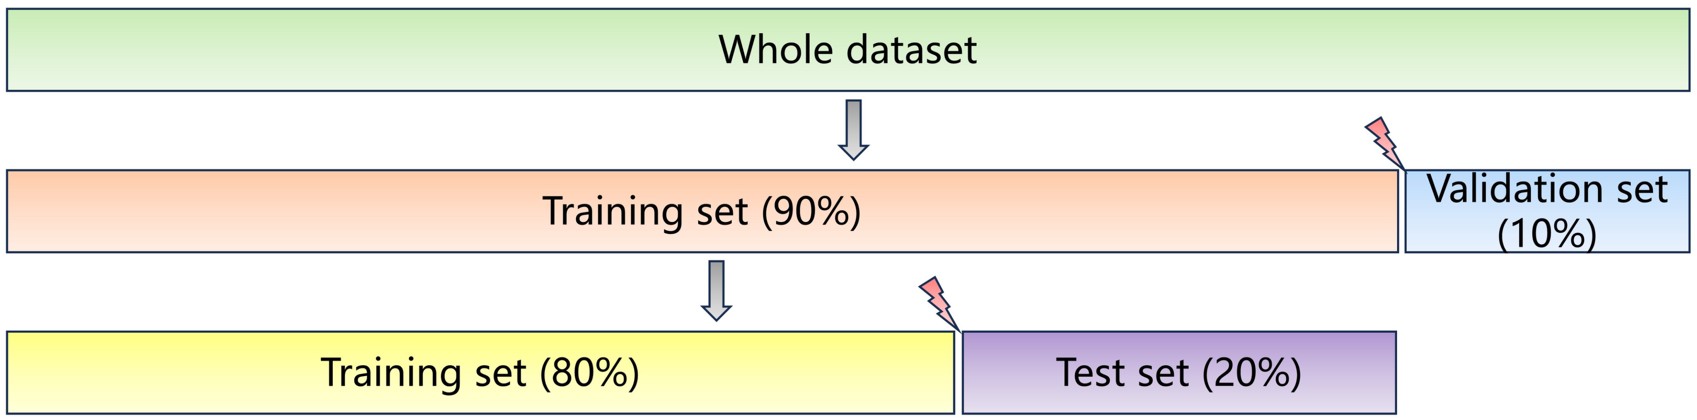
The final 3,476 acquired data were split such that 90% (3,128 samples) was allocated to the training set and 10% (348 samples) to the validation set. Subsequently, 90% of this initial training set was further split into a new training set (2,502 samples), while the remaining 20% (626 samples) was designated as the test set. This splitting process is illustrated in the schematic diagram below:
Supported by literature, an error tolerance of 1 pH unit was allowed, and the initial model achieved an accuracy of 88.82% on the test set and 89.37% on the validation set. Additionally, the accuracy within the allowable error range of 0.5 to 1 pH unit was calculated, and this result can be accessed on the Browse page. Notably, it can be observed that the model’s accuracy increases as the allowable error range expands, eventually approaching 100%.
4. Model Evaluation
The performance of the XGBoost model constructed in the previous step was evaluated on the test set using metrics including MAE (Mean Absolute Error), MSE (Mean Squared Error), RMSE (Root Mean Squared Error), and R². Innovatively, we converted this regression task into a classification task: binning was performed to create an accuracy metric. Supported by literature, an error tolerance of 1 pH unit was allowed, and the initial model achieved an accuracy of 89.14% on the test set. Additionally, accuracies within the allowable error range of 0.5 to 1 pH unit were calculated. The results are shown in the table below:
As observed, the accuracy increased with a larger allowable error, approaching 100%.
5. SHAP Analysis
The SHAP algorithm was used for black-box interpretation of the XGBoost model. By default, the top 20 feature genes were retained for feature analysis.
6. Website Development
Using Python programming, a user-friendly website for predicting the optimal growth pH of bacteria was developed based on tools including the Django framework, JavaScript, HTML5, and CSS3.