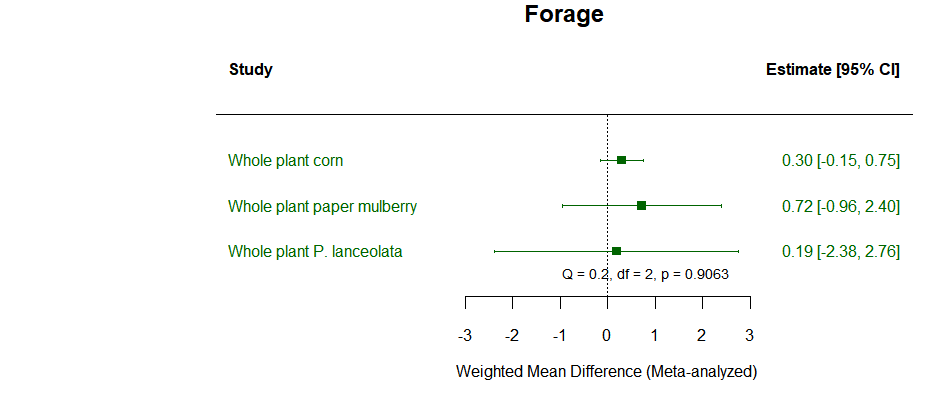
Figure 1:
Subgroup analysis (subgroup = forage type) of the effects of silage inoculation with lactic acid bacteria (LAB) on silage quality
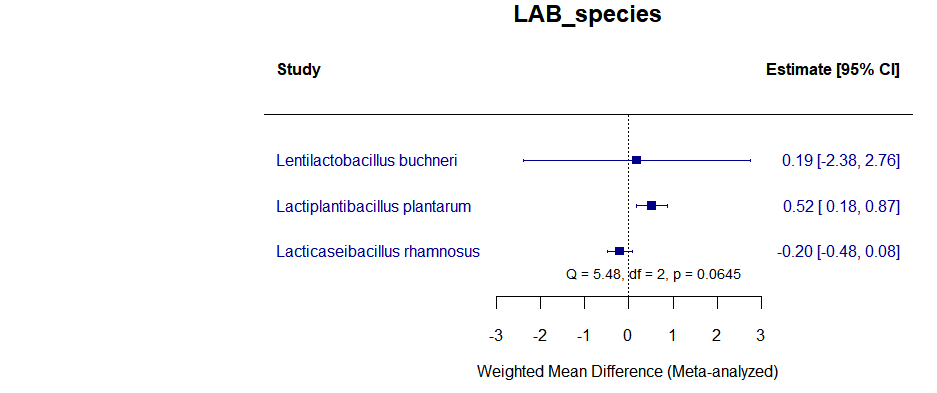
Figure 2:
Subgroup analysis (subgroup = LAB species) of the effects of silage inoculation with LAB on silage quality
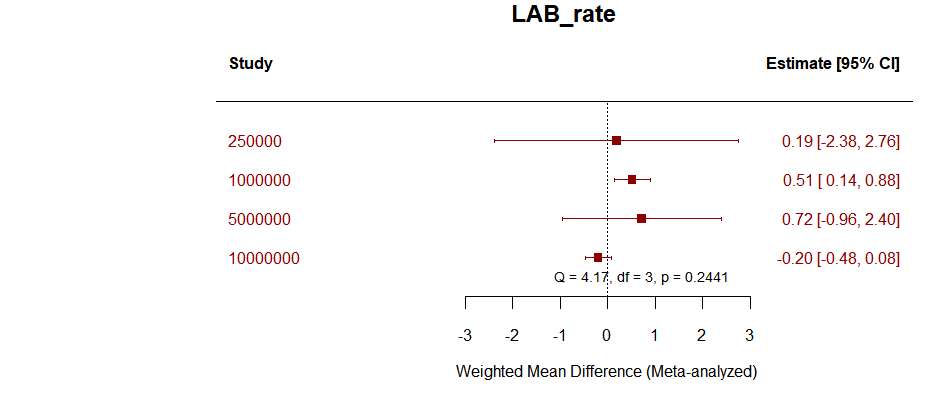
Figure 3:
Subgroup analysis (subgroup = LAB application rate) of the effects of silage inoculation with LAB on silage quality
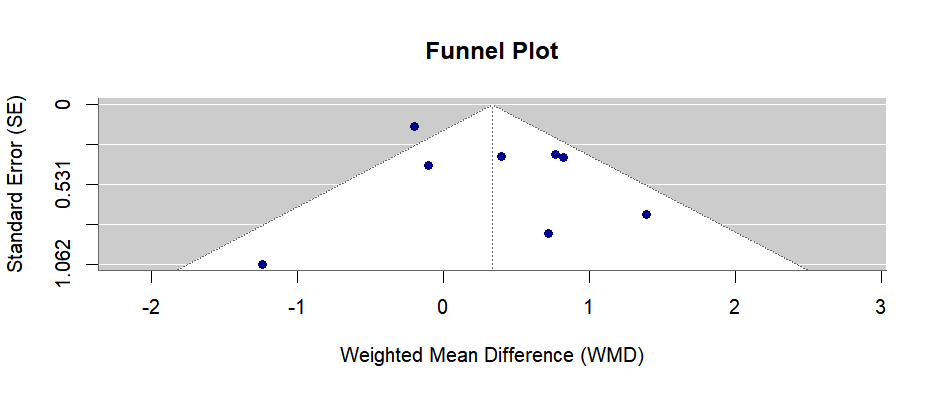
Figure 4:
Funnel plots showing the effects of silage inoculation LAB on silage quality