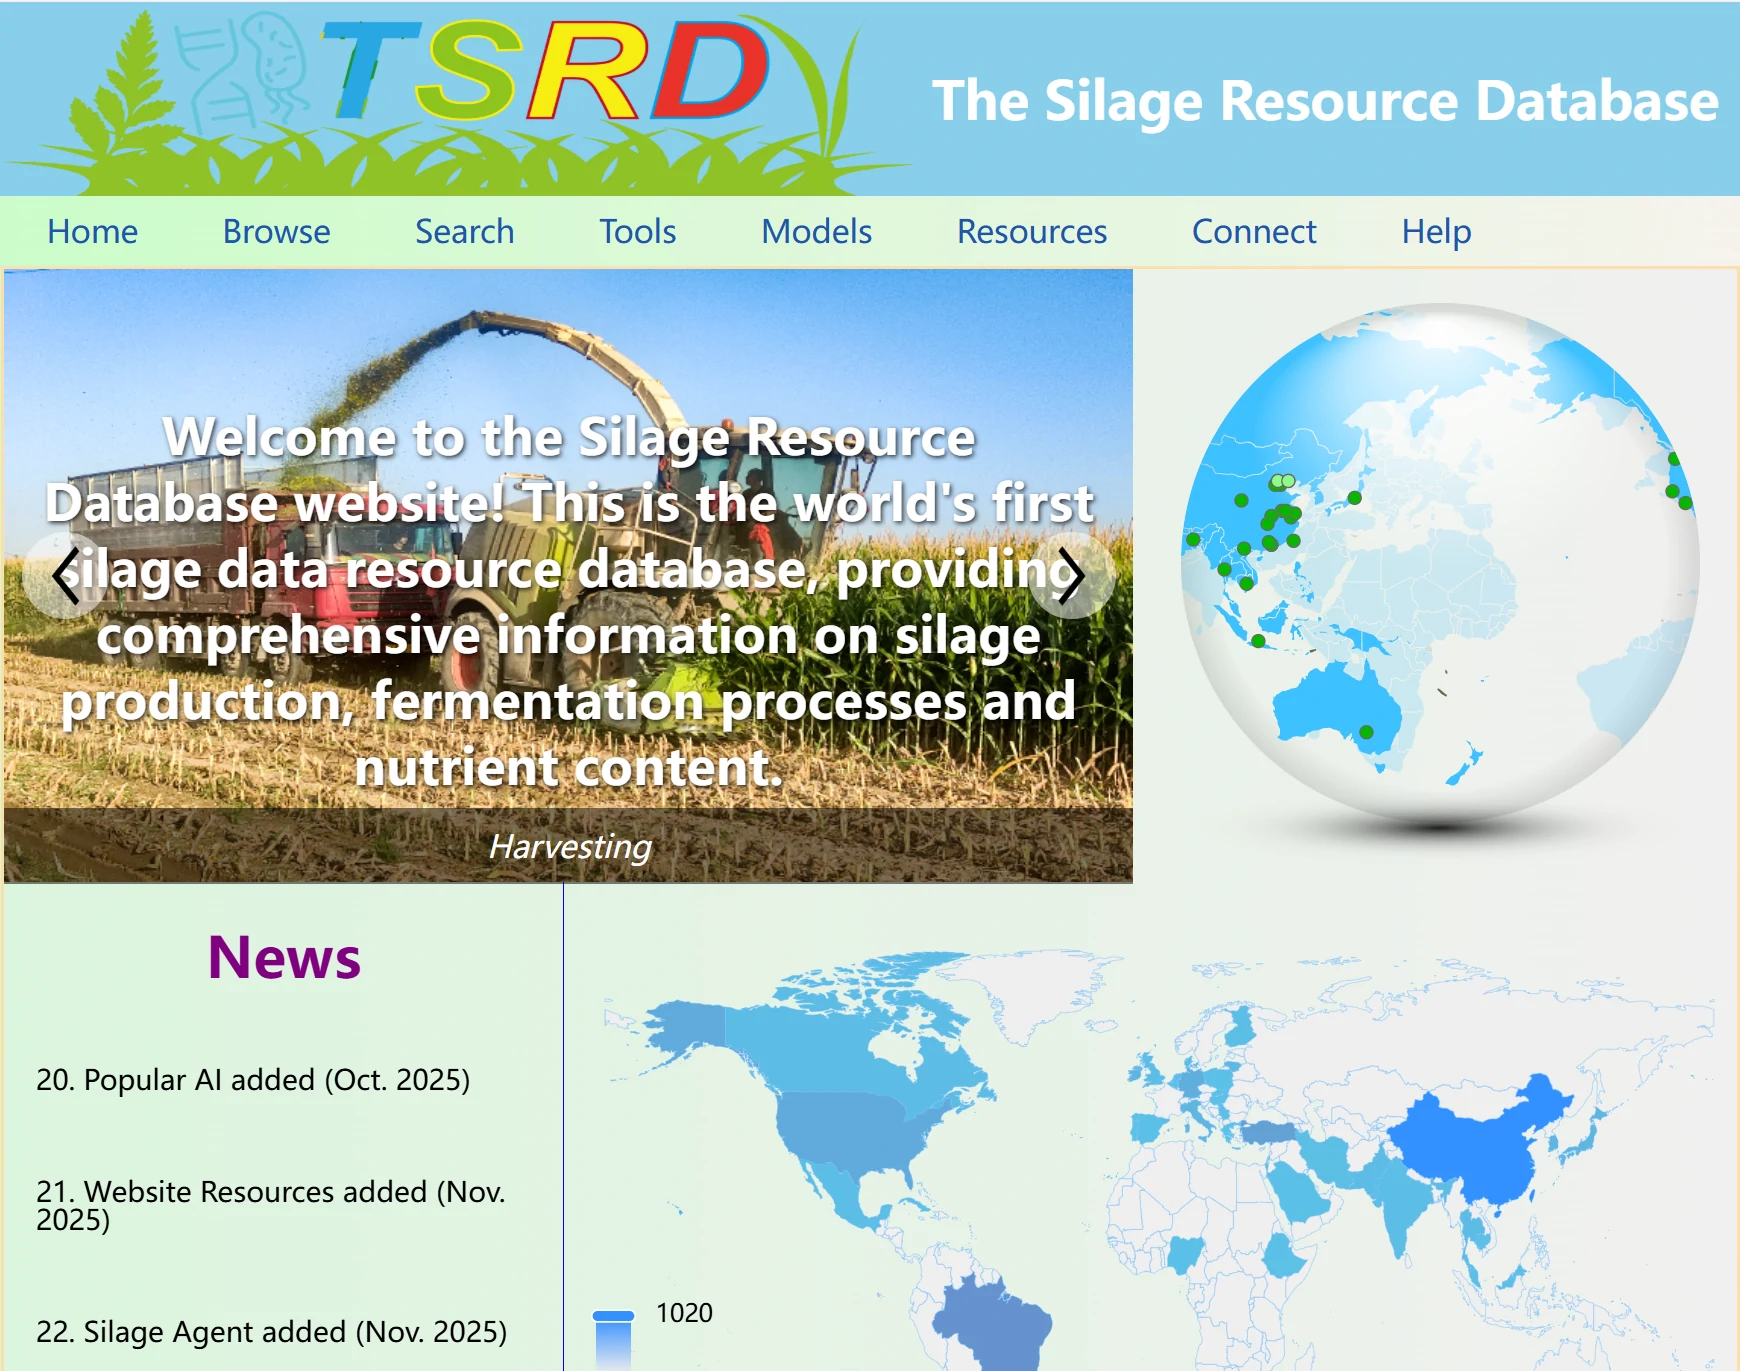
The Silage Resource Database home page serves as the central entry point to all platform features and resources. It provides a clear visual overview of the database's structure, with quick access to core modules including data browsing, bioinformatics tools, AI, literature resources, and data submission.
The home page also displays real-time updates such as newly added datasets, latest silage research news, and platform function optimizations, helping you stay abreast of the latest developments in silage research and industry applications.
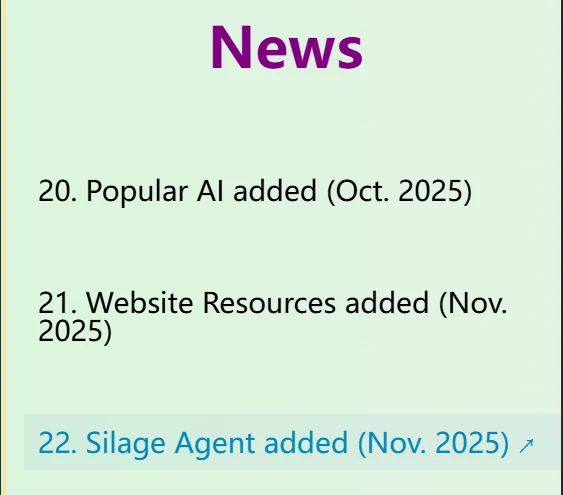
The News section displays the website's update times and features in a scrolling format. You can click to navigate to the newly added features. Note that when you move your mouse over the section, if the background color changes and a small arrow appears (as shown in the right image), it indicates that you can click to jump to the corresponding page. If the text turns red, it means the item is not clickable.
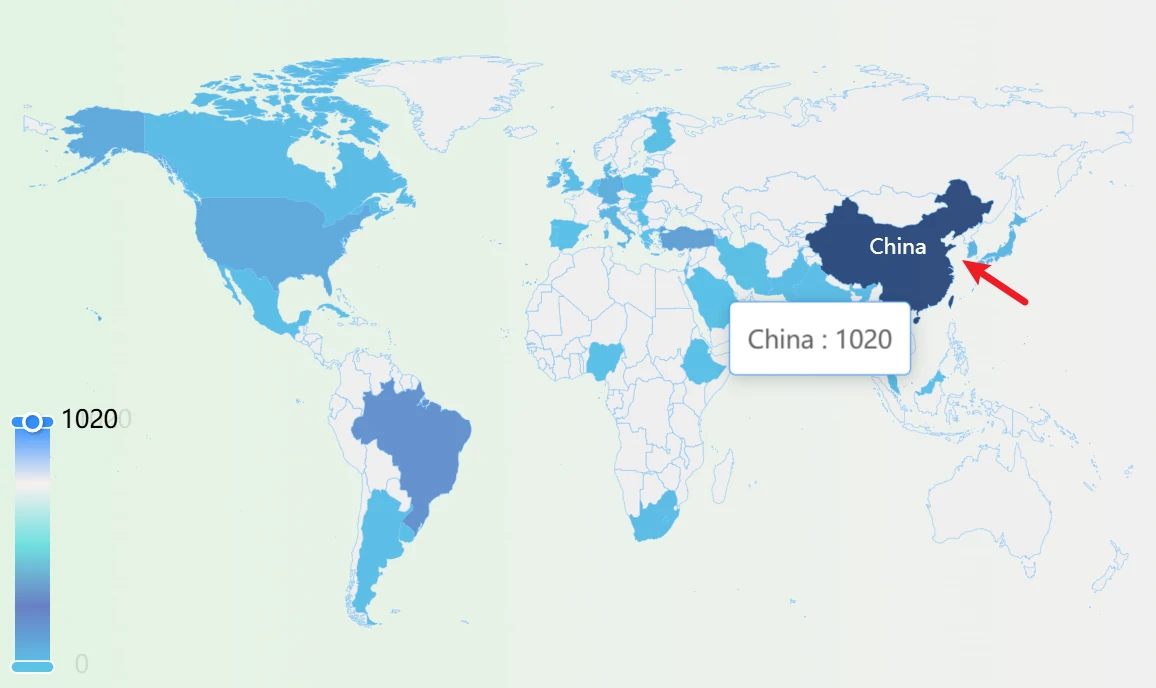
To the right of the News section is the map panel, which represents the number of data entries for each country in the database. The darker the color of a country’s area, the larger the data volume for that country in the database.
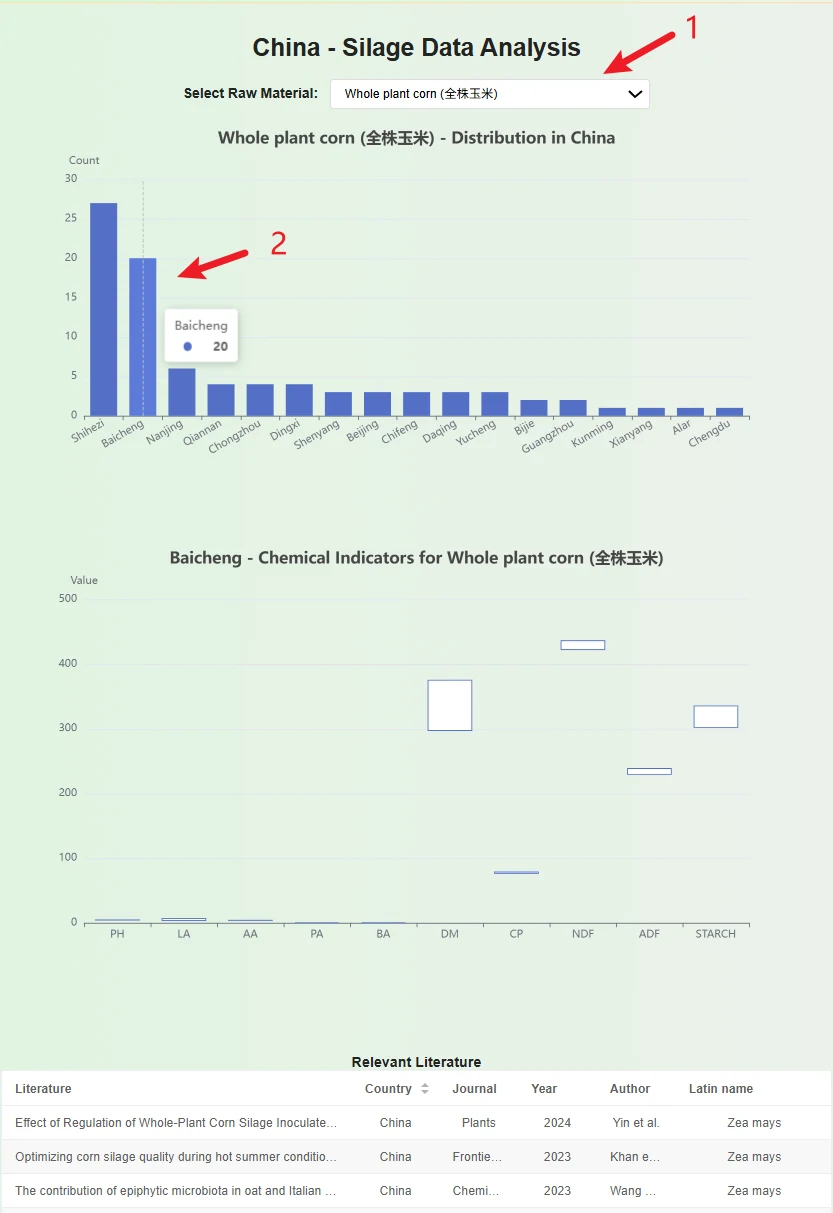
1. Select a silage material in the dropdown box, and a bar chart and table will appear below. The bar chart represents the data volume for each city in the country in the database, while the table below records which literature each data entry comes from.
2. Place the cursor over the bar chart showing the number of data entries for cities to view the data volume for that city in the database. You can click on the bar chart to get a box plot of the data, which allows you to observe the data range for that city.
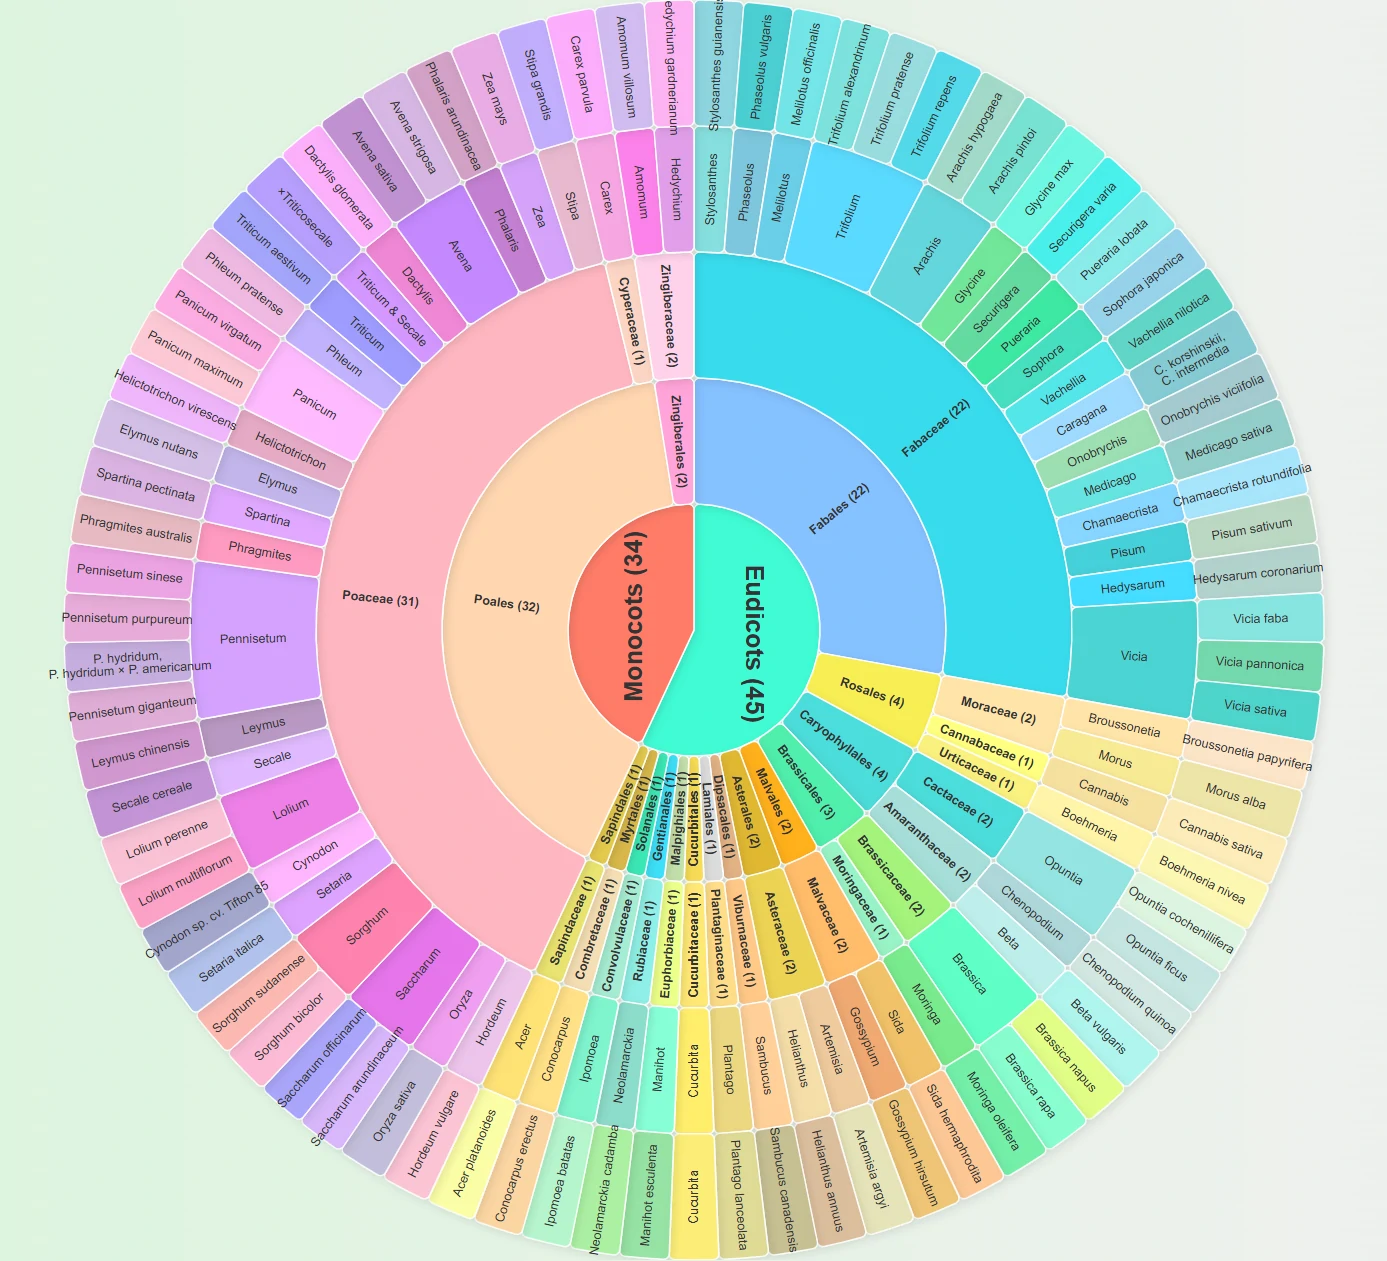
This circular chart illustrates the taxonomic system of silage raw materials in our database, clearly presenting two core groups of silage crops:
The inner circle labels the number of species in the two major plant groups: 34 species of Monocots and 45 species of Eudicots, totaling 79 species.
The middle layer shows the species distribution of key families: within Monocots, Poaceae accounts for 31 species (the primary silage raw materials, such as corn and sorghum); within Eudicots, Fabaceae accounts for 21 species (such as alfalfa and clover).
The outer layer lists specific species names (e.g., Zea mays [corn], Medicago sativa [alfalfa]).
This taxonomic chart allows you to quickly grasp the range of silage crops covered in the database.
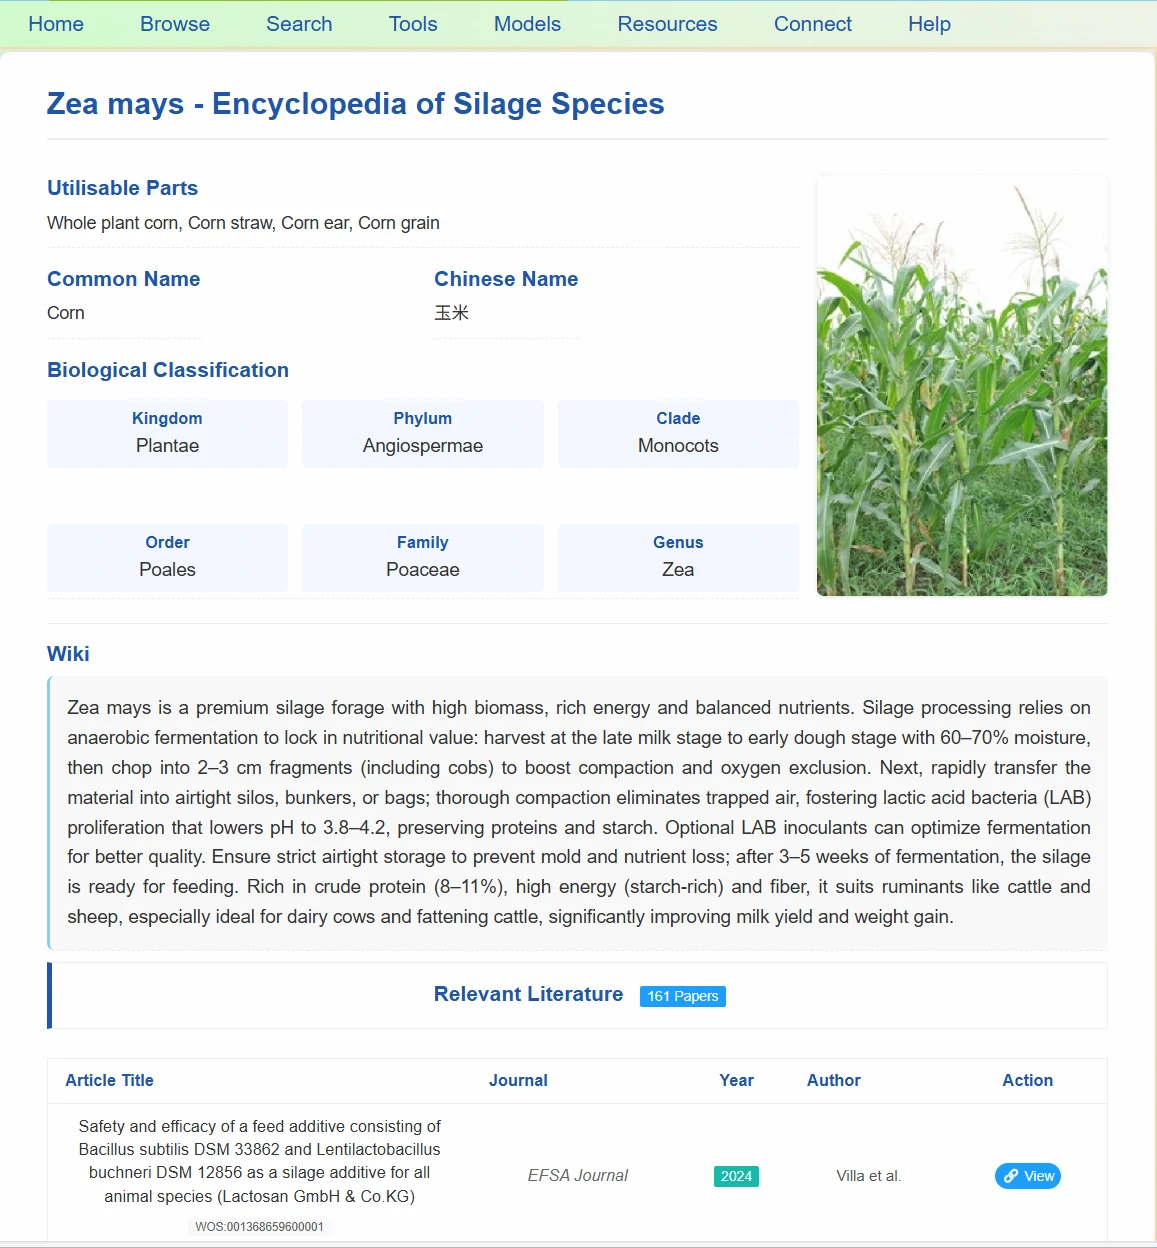
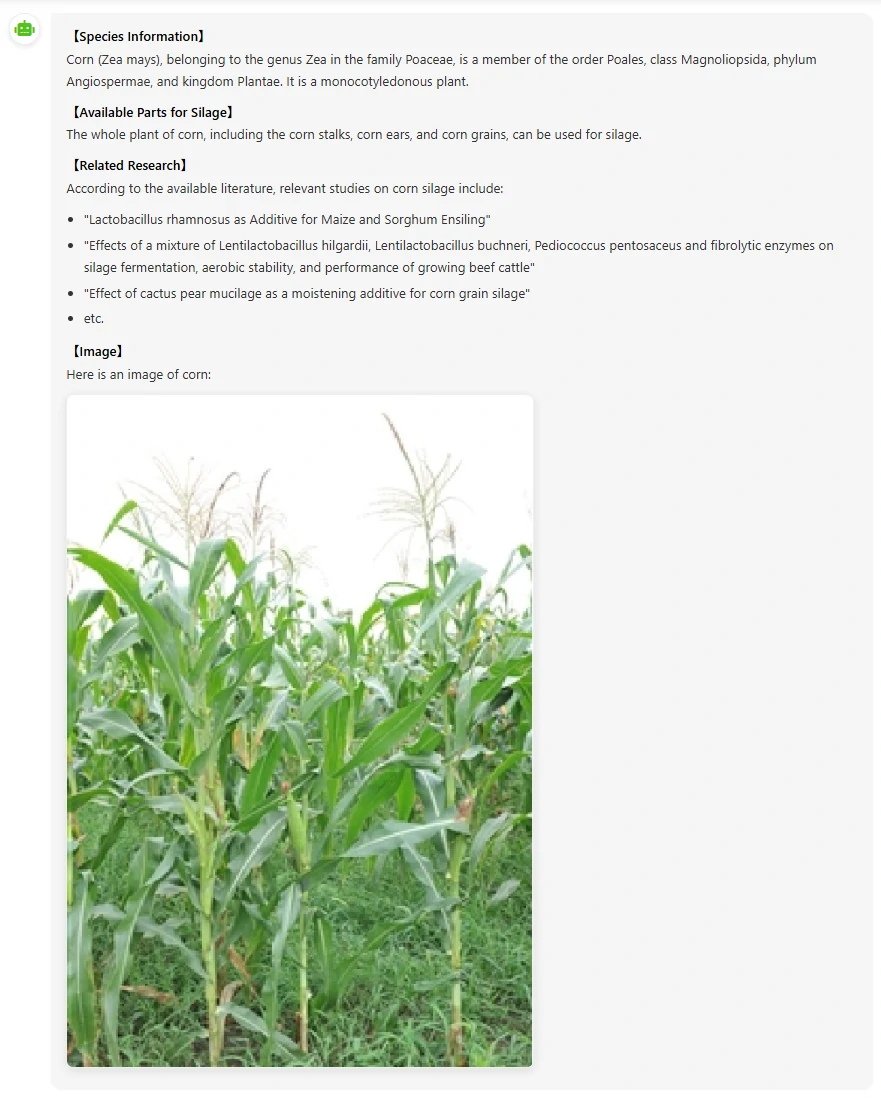
By clicking on the end nodes of the sunburst chart, you can jump to the page displaying detailed species information: including the specific silageable parts (whole plant, straw, etc.), Chinese and English names, and the complete biological classification from kingdom to genus. The page displays images of the species and provides literature information related to silage using that species.
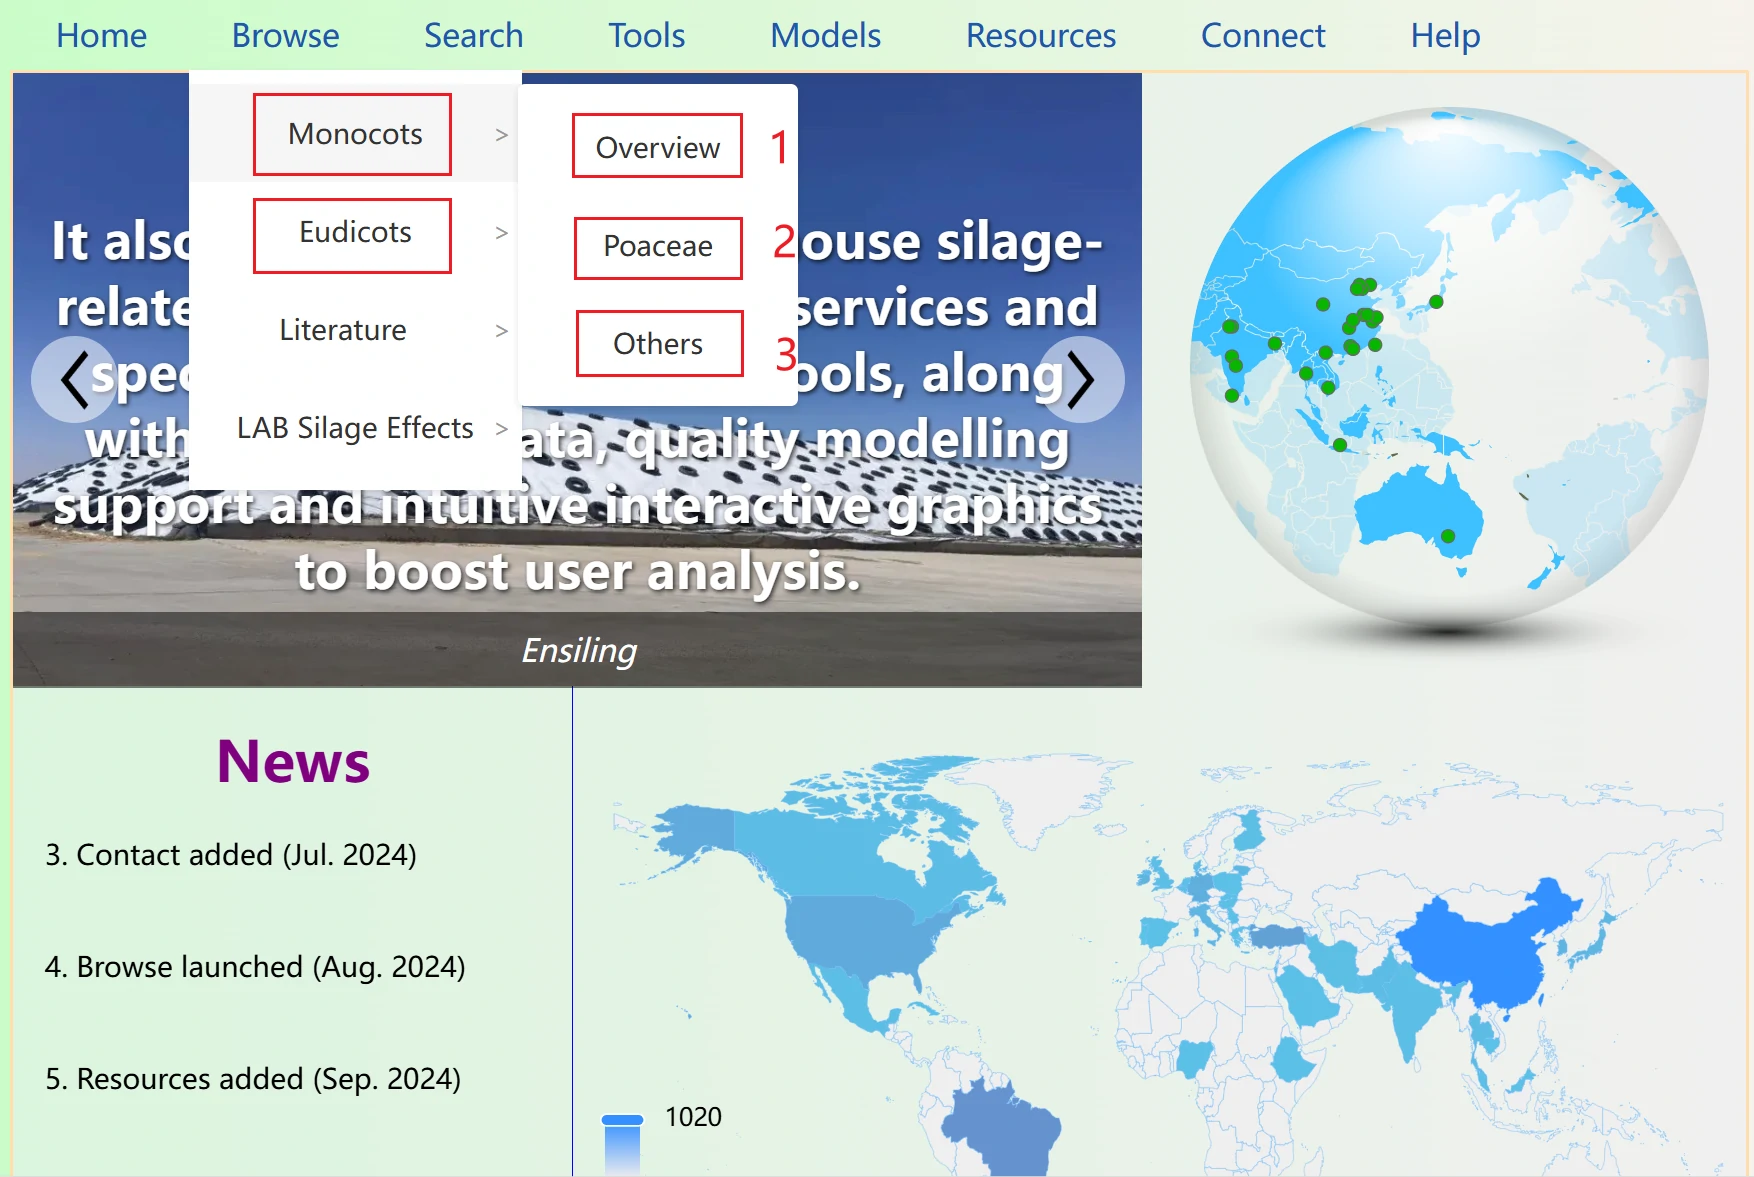
The options Monocots and Eudicots display the data split according to the biological classification of the raw materials. Poaceae and Fabaceae are the families with the largest data volumes in monocots and eudicots, respectively, so they are presented on separate dedicated pages.
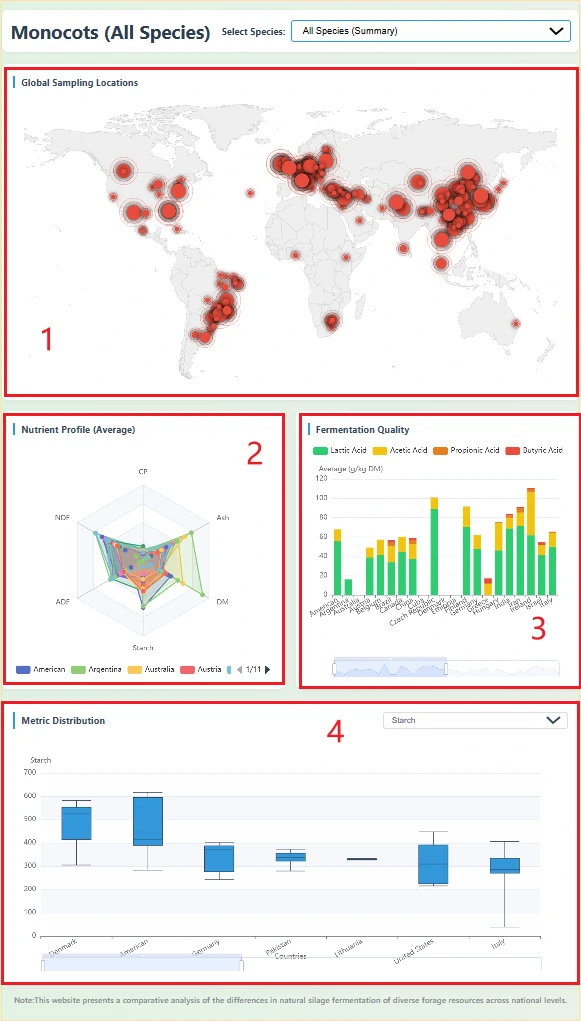
1. Global Sampling Distribution Map
Marks the cities of origin for silage samples on a world map, based on latitude and longitude information in the database. The size of the red dots represents the number of samples at that location (the more samples, the larger the dot).
2. Nutritional Profile Radar Chart
Shows the average performance of silage from each country across six key nutritional indicators.
Values are country-level averages. The shape of the radar chart allows you to quickly judge the nutritional emphasis of silage from different countries.
3. Fermentation Quality Stacked Bar Chart
The X-axis represents different countries. The Y-axis represents the average total content of organic acids. The taller the bar, the greater the total amount of organic acids produced during fermentation, indicating a more intense fermentation process.
4. Metric Distribution Box Plot
An interactive chart. Users can select a specific metric (such as pH, Starch, Dry Matter) from the dropdown box in the upper right corner to view the statistical distribution of that metric across countries. By switching to “All Metrics,” users can also compare the magnitude differences among different metrics in the database.
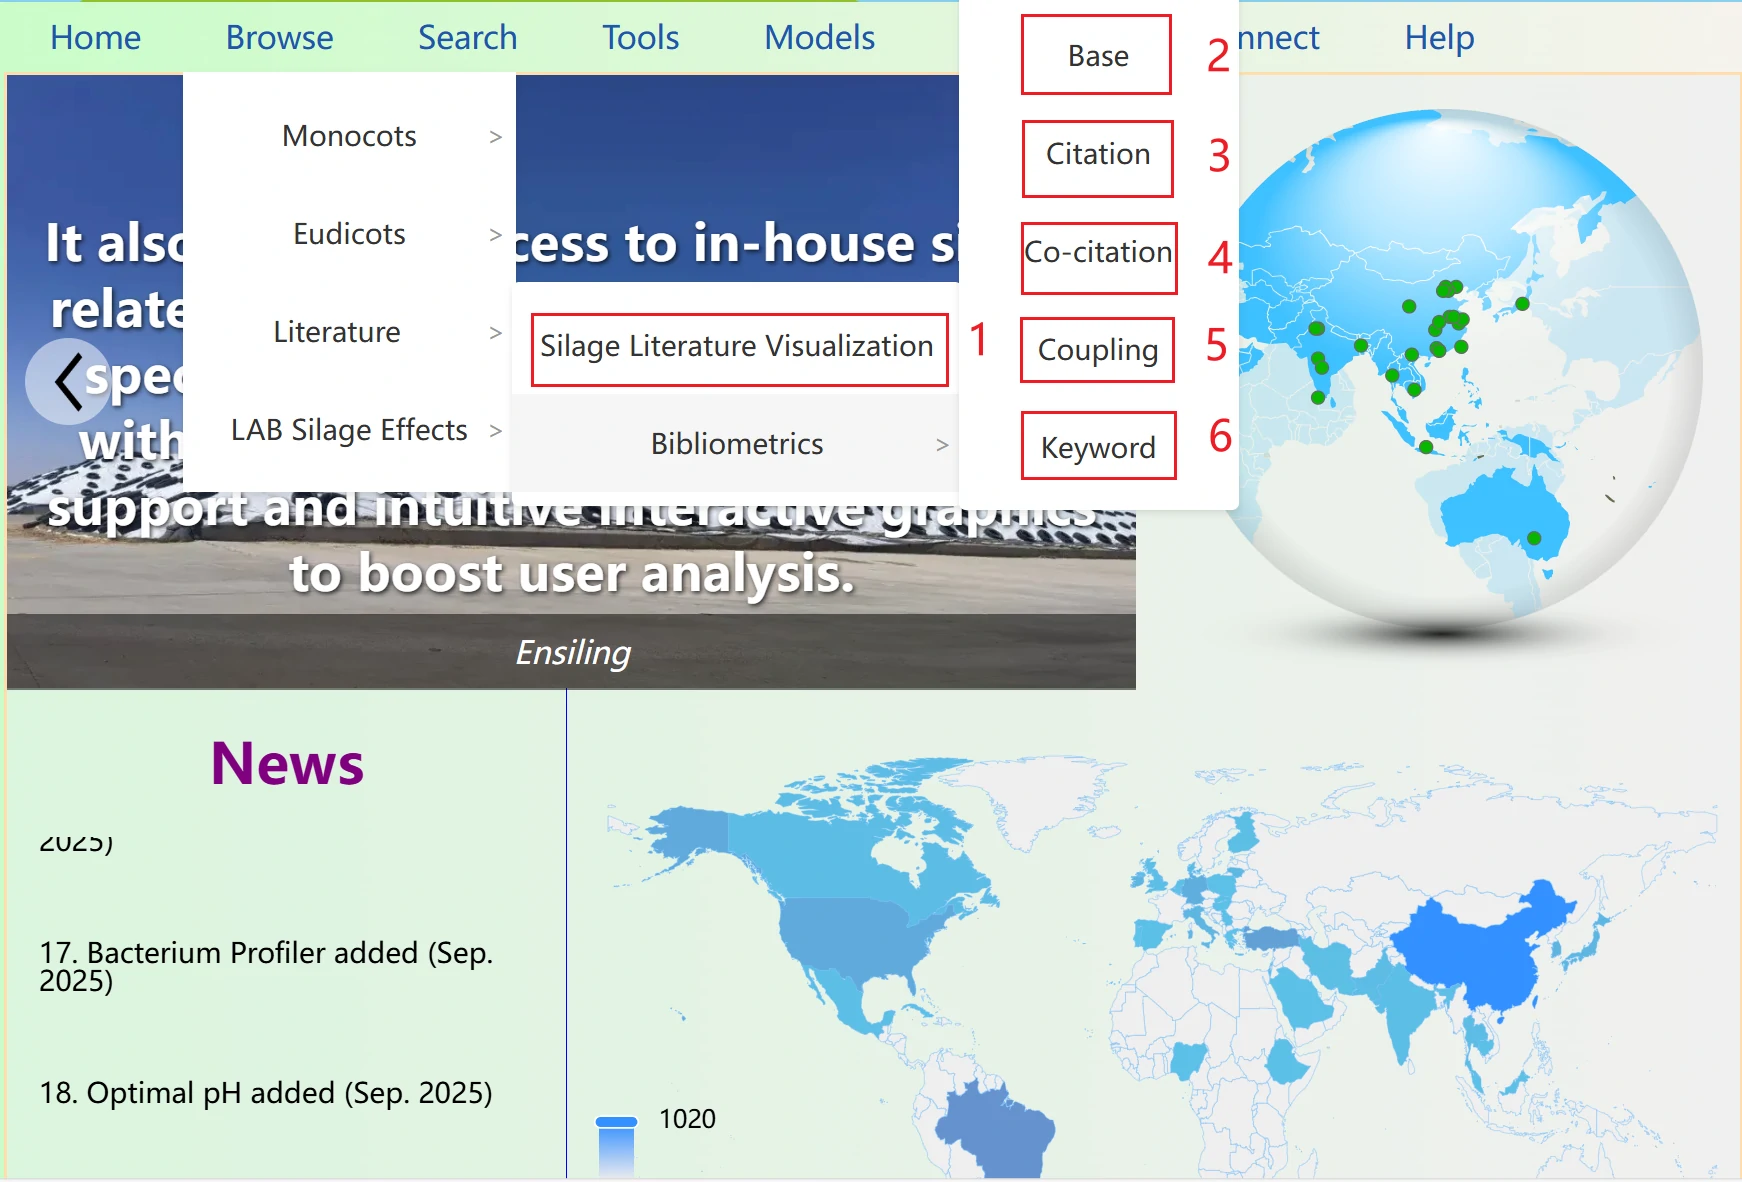
1. Silage Literature Visualization displays information related to the literature collected in the database.
2. It analyzes and visualizes the basic information of the literature.
3. It analyzes and visualizes the citation information of the literature.
4. It analyzes and visualizes the co-citation information of the literature.
5. It analyzes and visualizes the coupling information of the literature.
6. It analyzes and visualizes the keyword information of the literature.
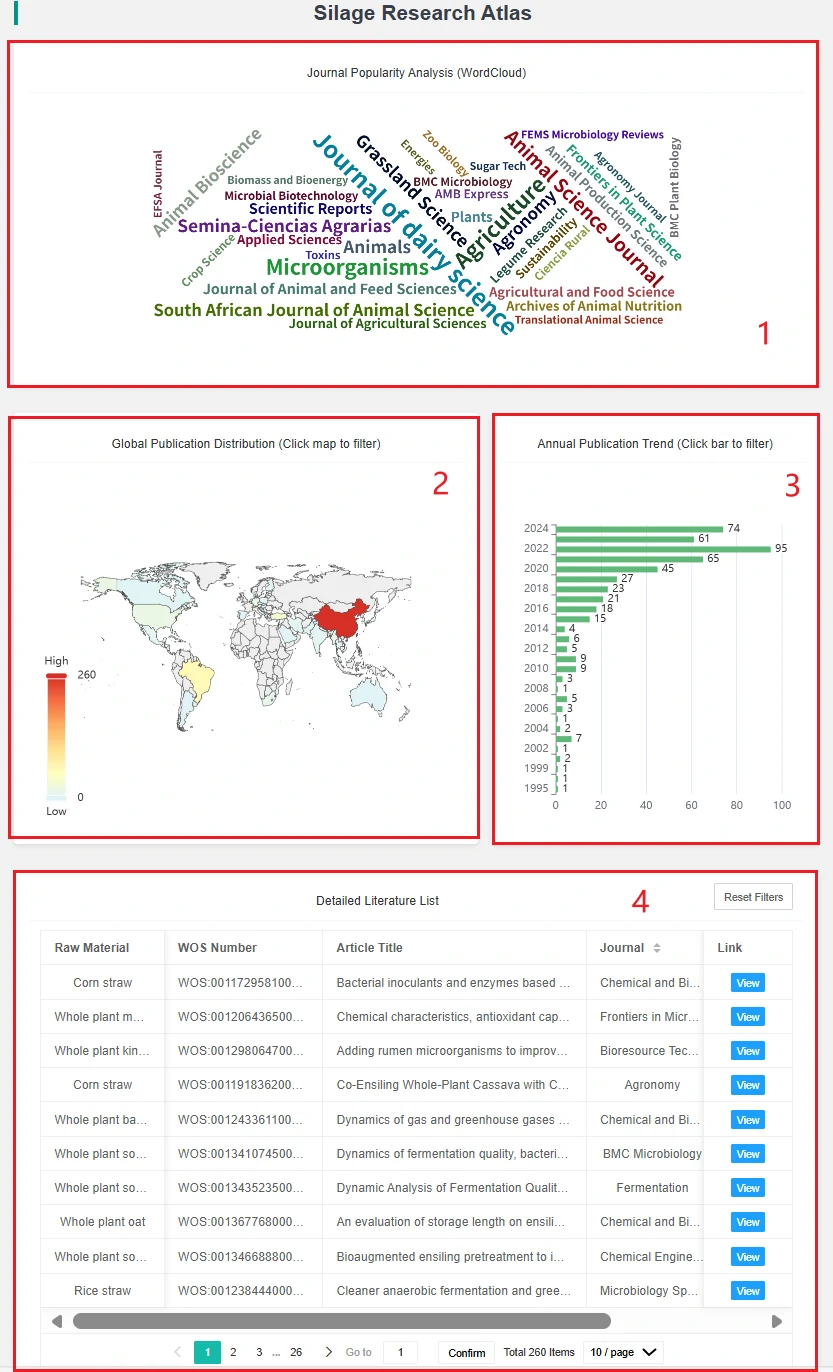
1. This is a word cloud of journals, showing the number of papers collected in the database from different journals. Clicking on a journal will display a table of papers published in that journal.
2. This is a global distribution map of papers, indicating which country each paper comes from. The depth of color in each country's section reflects the number of papers, allowing users to easily compare. Clicking on a country will display a table of papers from that country.
3. This is a bar chart of publication years, showing the number of papers published in different years. Clicking on a year bar will display a table of papers published in that year.
4. This is the paper information table displayed after filtering by country or year.
The Base, Citation, Co-citation, Coupling, and Keyword sections display bibliometric analysis charts created via the CiteSpace and VOSviewer tools. Users can click on the PDF, PNG, and HTML tabs to obtain higher-definition images.
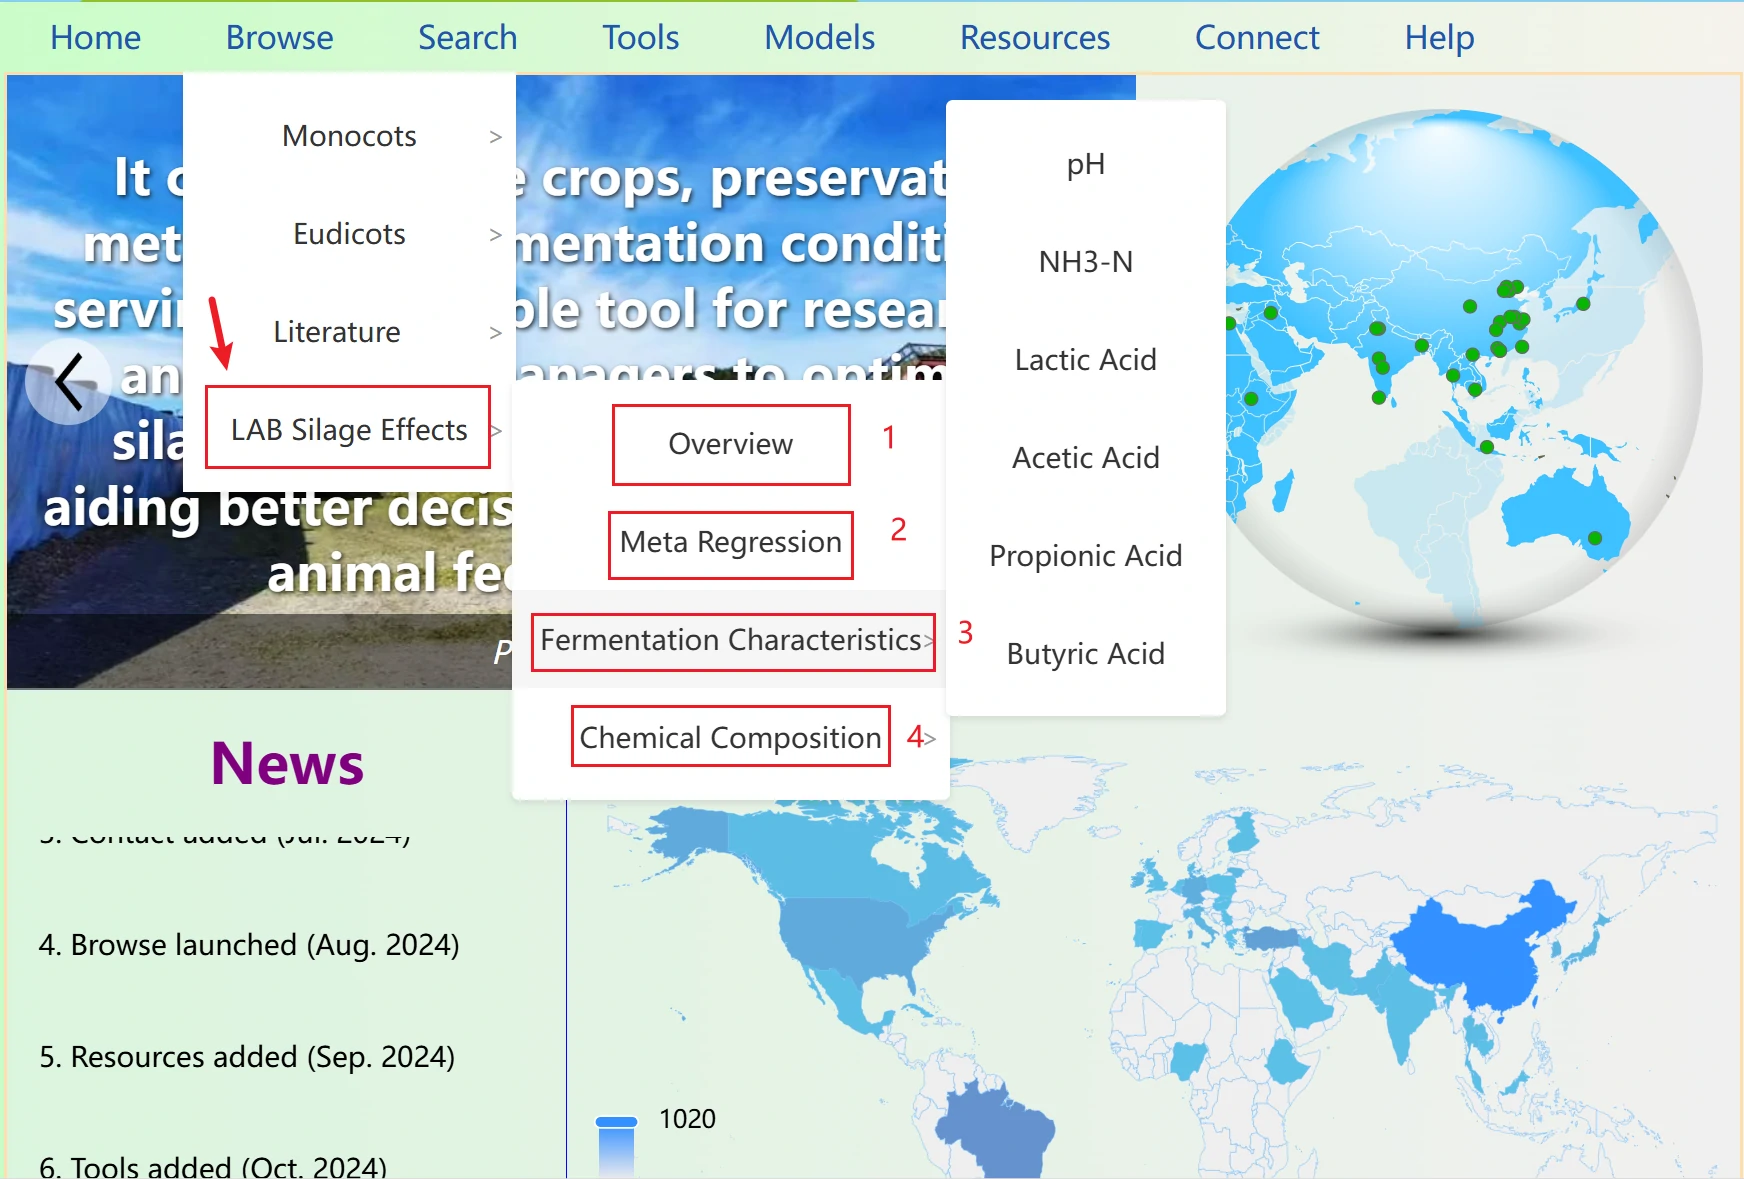
1. This is the analysis table titled "Effects of Lactic Acid Bacteria Inoculants on the Fermentation Quality of Silage". It presents the results of how lactic acid bacteria inoculants (experimental groups) affect various silage quality indicators compared to a blank control group. This table serves as a core statistical tool for research on the application of silage microorganisms.
2. This is a meta-regression analysis table for the effects of silage lactic acid bacteria (LAB) inoculants. Its core purpose is to explore the impacts of three factors—forage type, LAB species, and LAB inoculation rate—on the relative mean difference (RMD) of silage quality indicators between LAB inoculant treatments and the control group. It serves as a statistical tool for quantifying the moderating factors of inoculant effects.
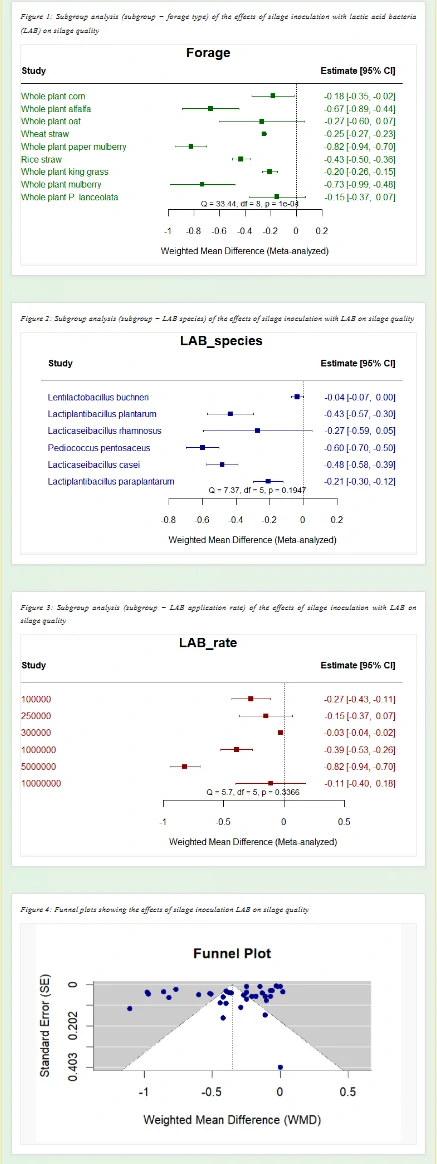
This page presents the subgroup analysis results of lactic acid bacteria (LAB) inoculants on silage core indexes using metafor package and Stata software, a core visualization tool for refining effect differences in meta-analysis. It accurately splits the source of differences in the regulatory effect of LAB inoculants on silage indexes, and clarifies the actual effect of inoculants under different experimental conditions.
(1) Subgroup Analysis by Forage Type
Grouped by silage raw material types (e.g., whole-plant corn, alfalfa, wheat straw), it shows the regulatory effect of LAB inoculants on target indexes under different forages. Estimate represents the mean difference of the index, and the 95% CI (confidence interval) reflects the reliability of the result. For example, a negative Estimate for the pH index means the inoculant can reduce the silage pH value.
(2) Subgroup Analysis by LAB Species
Grouped by LAB strains (e.g., Lactobacillus buchneri, Lactobacillus plantarum), it compares the differences in the effect of different LAB species on silage indexes after inoculation, and screens out the strains with more significant regulatory effect on the target index.
(3) Subgroup Analysis by LAB Rate
Grouped by LAB inoculation dosage (different concentration gradients), it analyzes the influence of different inoculation amounts on the index regulatory effect, and provides a scientific reference for the optimal dosage of LAB inoculants in actual production and research.
(4) Funnel Plot for Publication Bias Assessment
A special statistical chart for evaluating the publication bias of meta-analysis results: if the data points are symmetrically distributed within the funnel, it indicates low publication bias of the included studies and more reliable analysis conclusions; asymmetric distribution suggests potential bias that needs to be considered in the research.
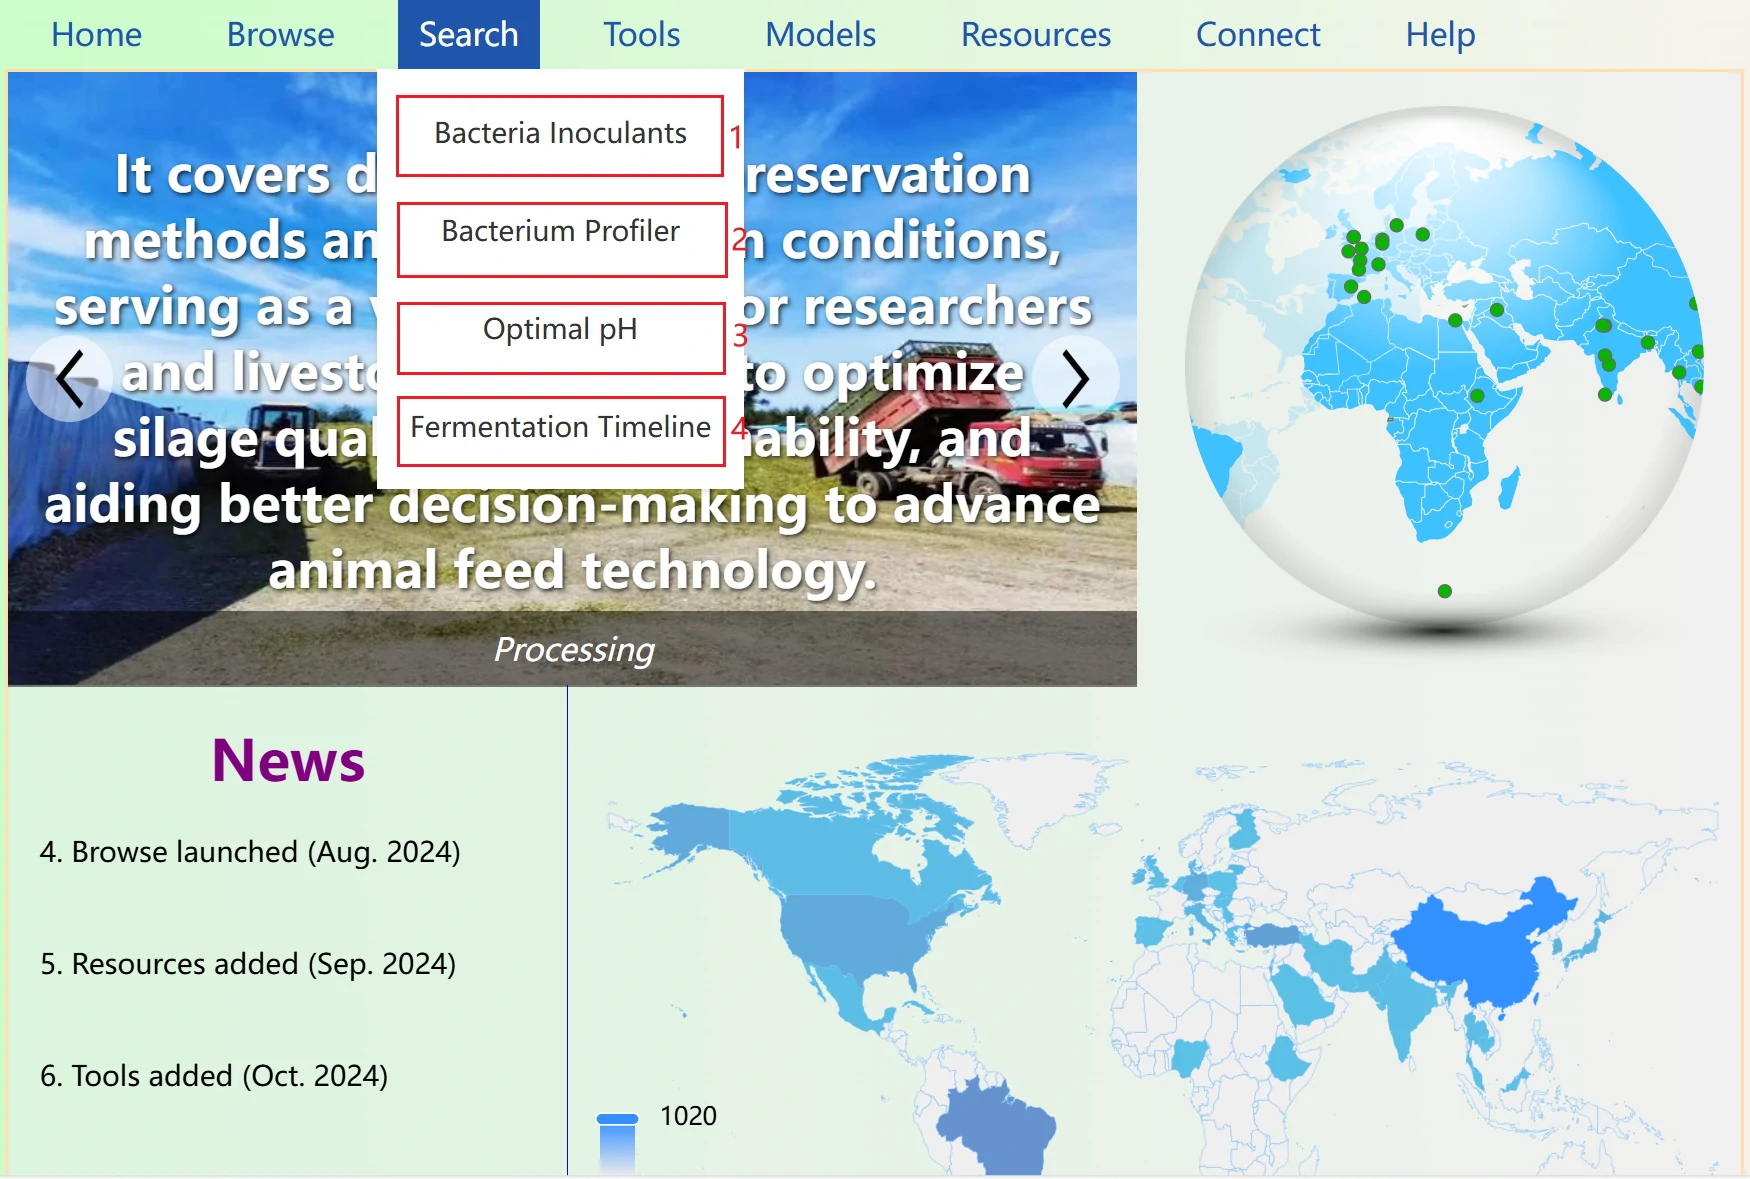
We provide a multi-dimensional advanced search function to help you quickly retrieve valuable silage data.
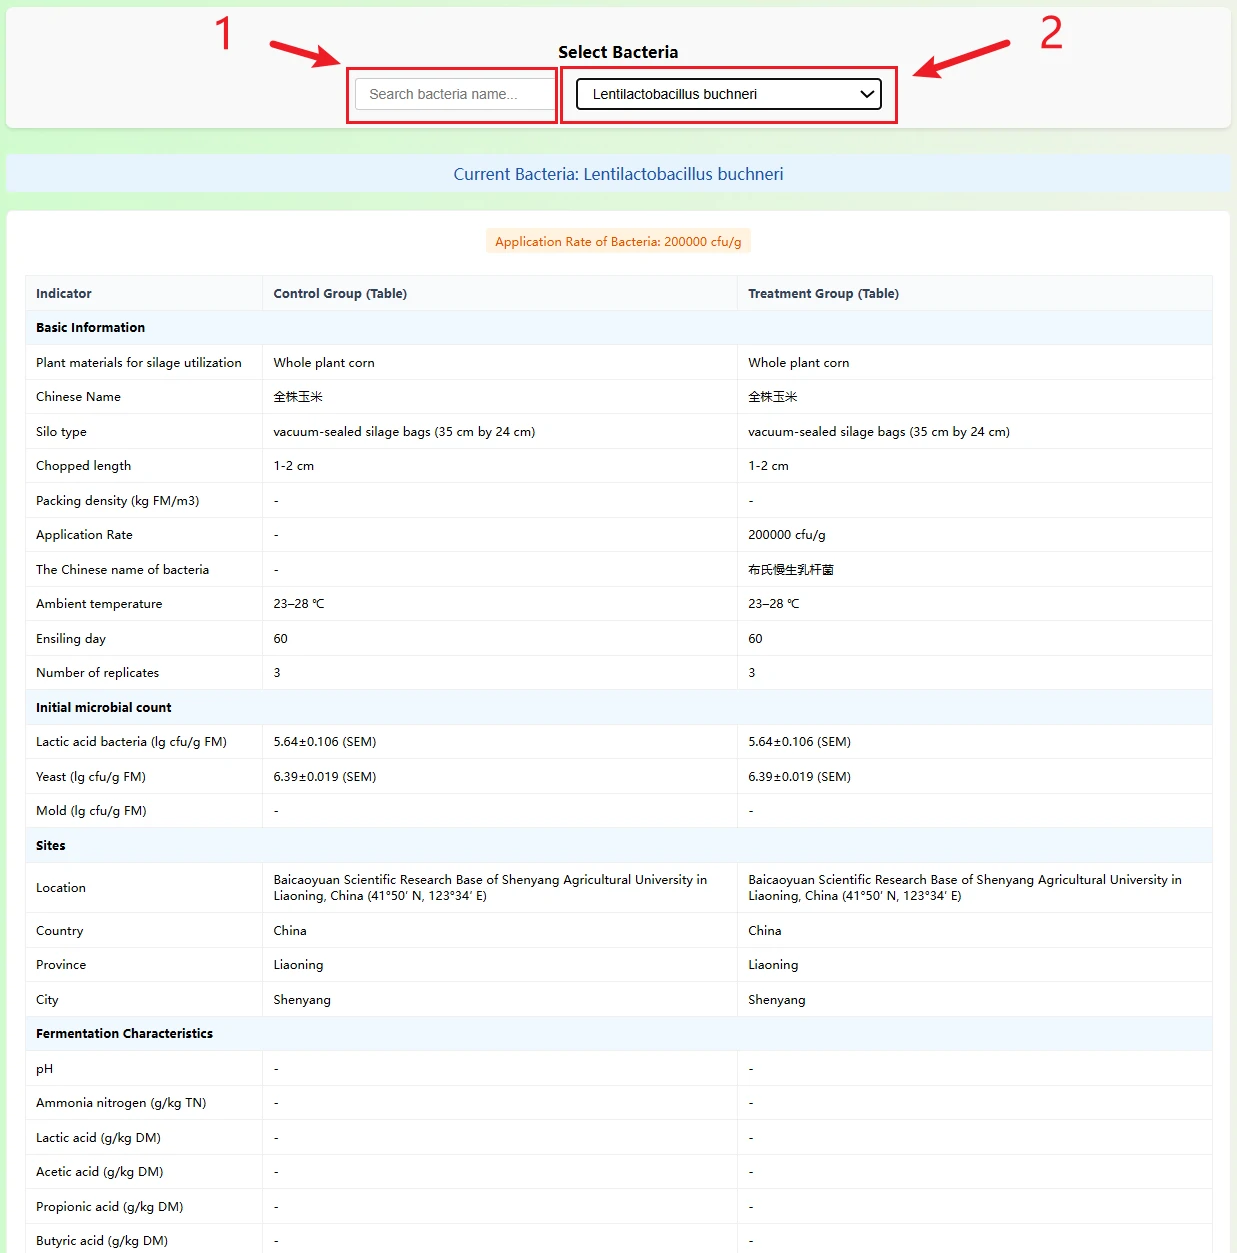
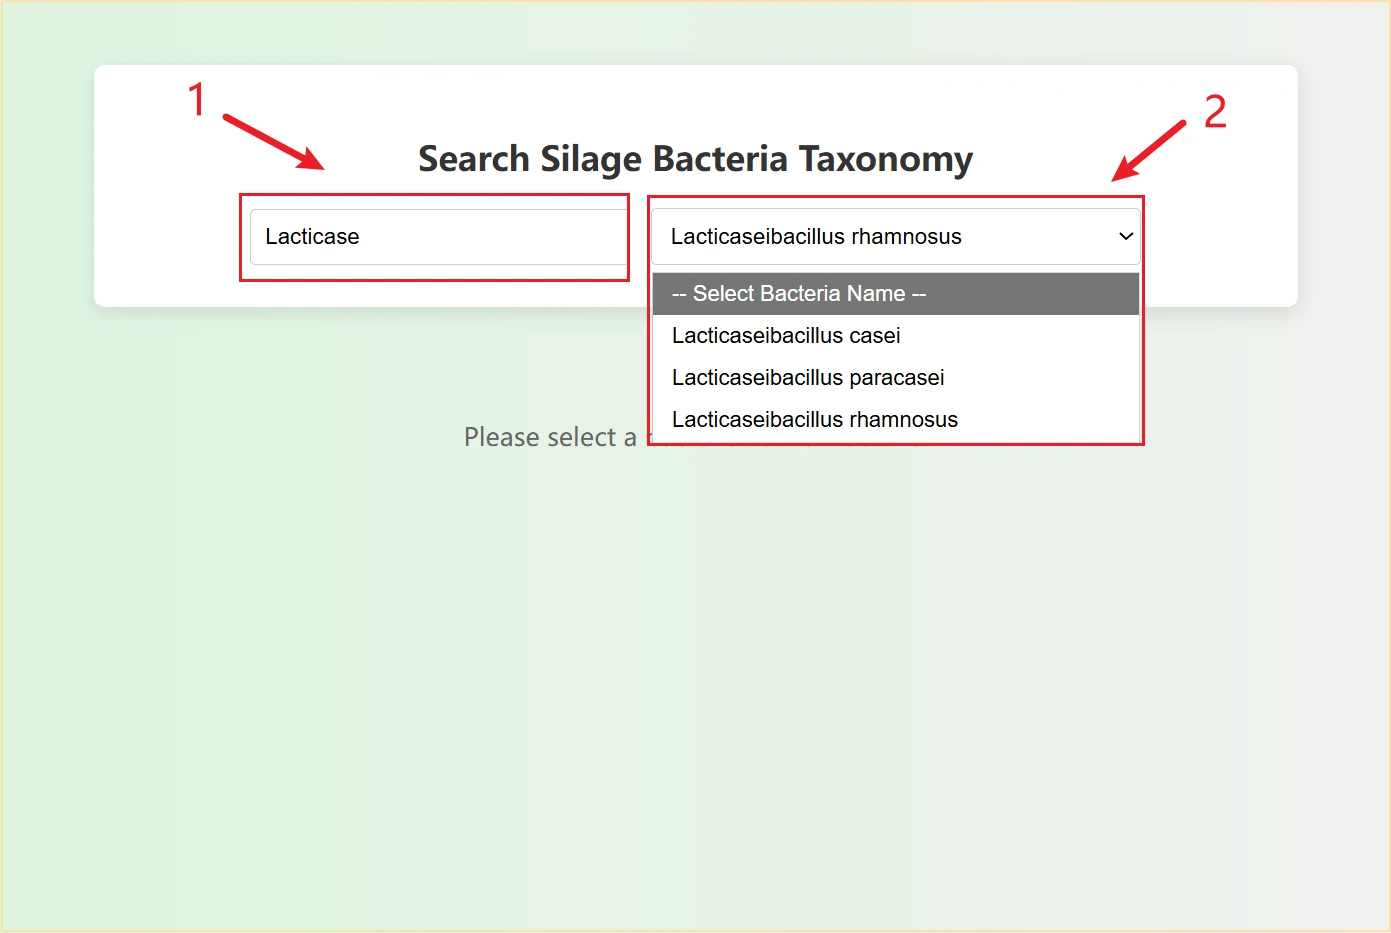
This page serves as a silage inoculant effect comparison tool: by searching or selecting a specific lactic acid bacteria strain via the dropdown menu, it automatically displays a comparison of silage data between the "control group (uninoculated)" and the "treatment group (inoculated with this strain)", covering dimensions such as basic experimental conditions, fermentation characteristics, and nutritional components. Meanwhile, horizontal bar charts visually present the differences in each indicator, helping to quickly assess the actual impact of the strain on silage quality.
(1) Bacteria Selection Area
You can quickly locate the target strain through:
(2) Core Comparison Content:The page displays multi-dimensional index comparisons in table + chart form:
1. You can enter strain keywords (e.g., genus or species name) in the search box for fuzzy matching, or directly select pre-stored silage-related strains from the dropdown list. After selection, the page will automatically load all information of the corresponding strain for convenient operation.
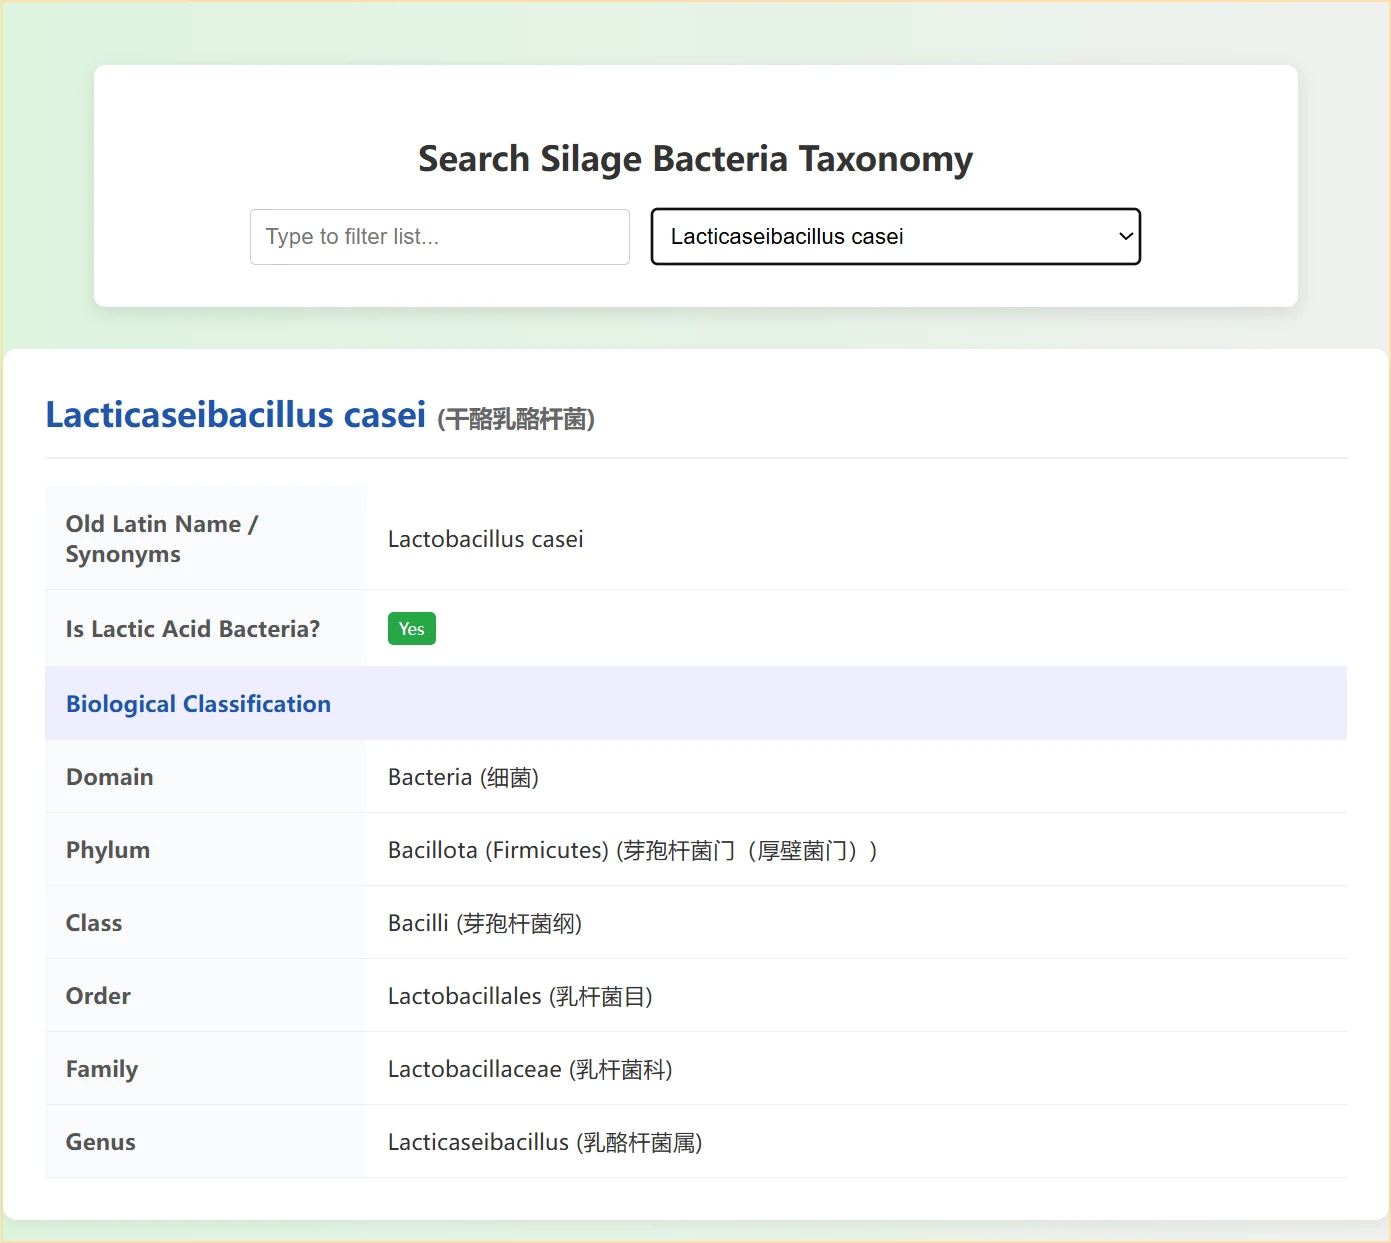
2. The page displays core key information of the strain:
First, basic attributes, including the standard Latin name (with Chinese translation) and former synonyms of the strain, as well as a clear label indicating whether the strain is a lactic acid bacterium (a core functional bacterium in silage). Second, the complete biological taxonomic hierarchy, showing full classification from domain (Bacteria) to genus, with Latin names and Chinese translations provided for each taxonomic level, making the classification relationship clear and accessible.
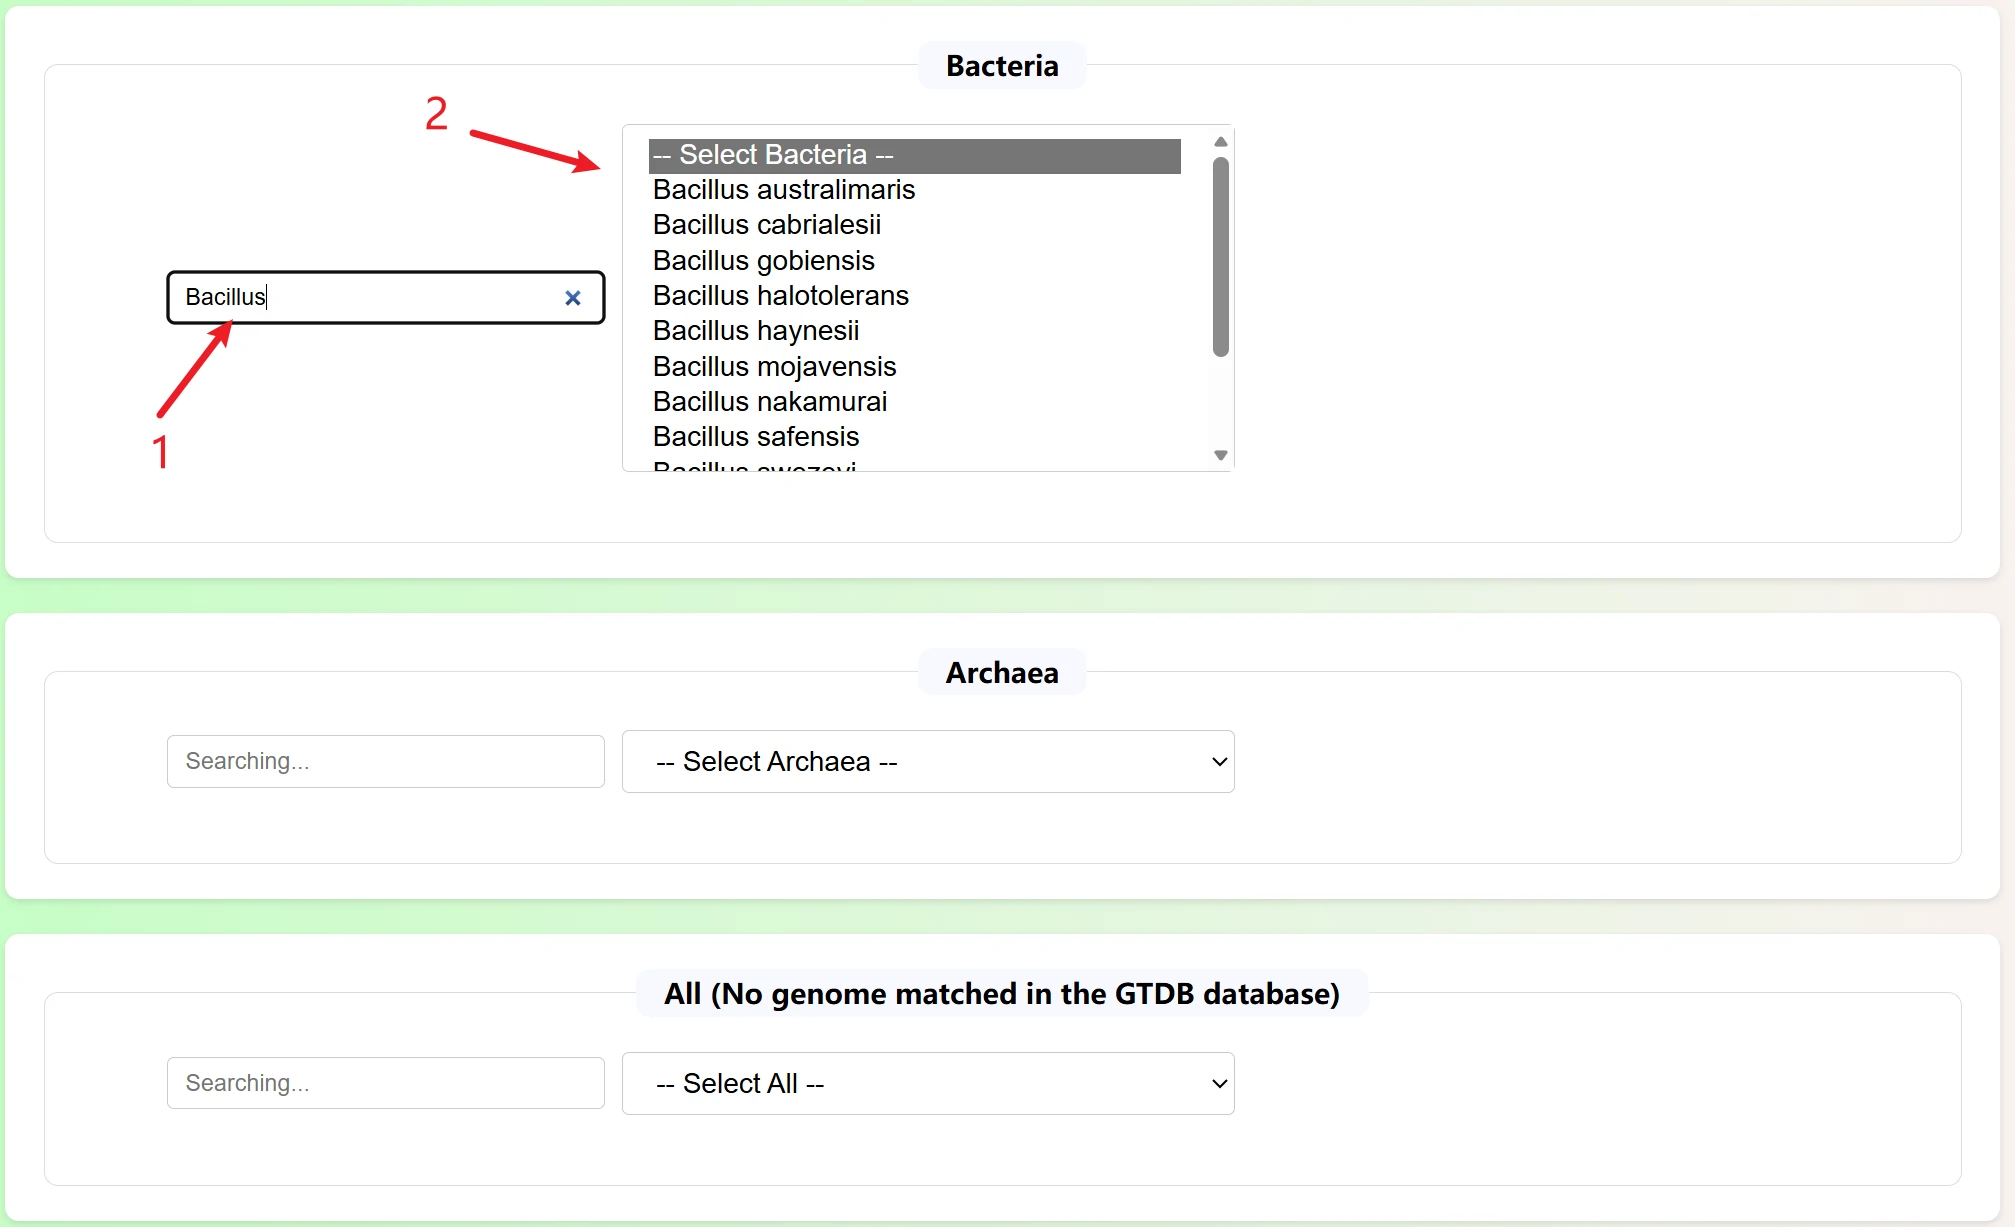
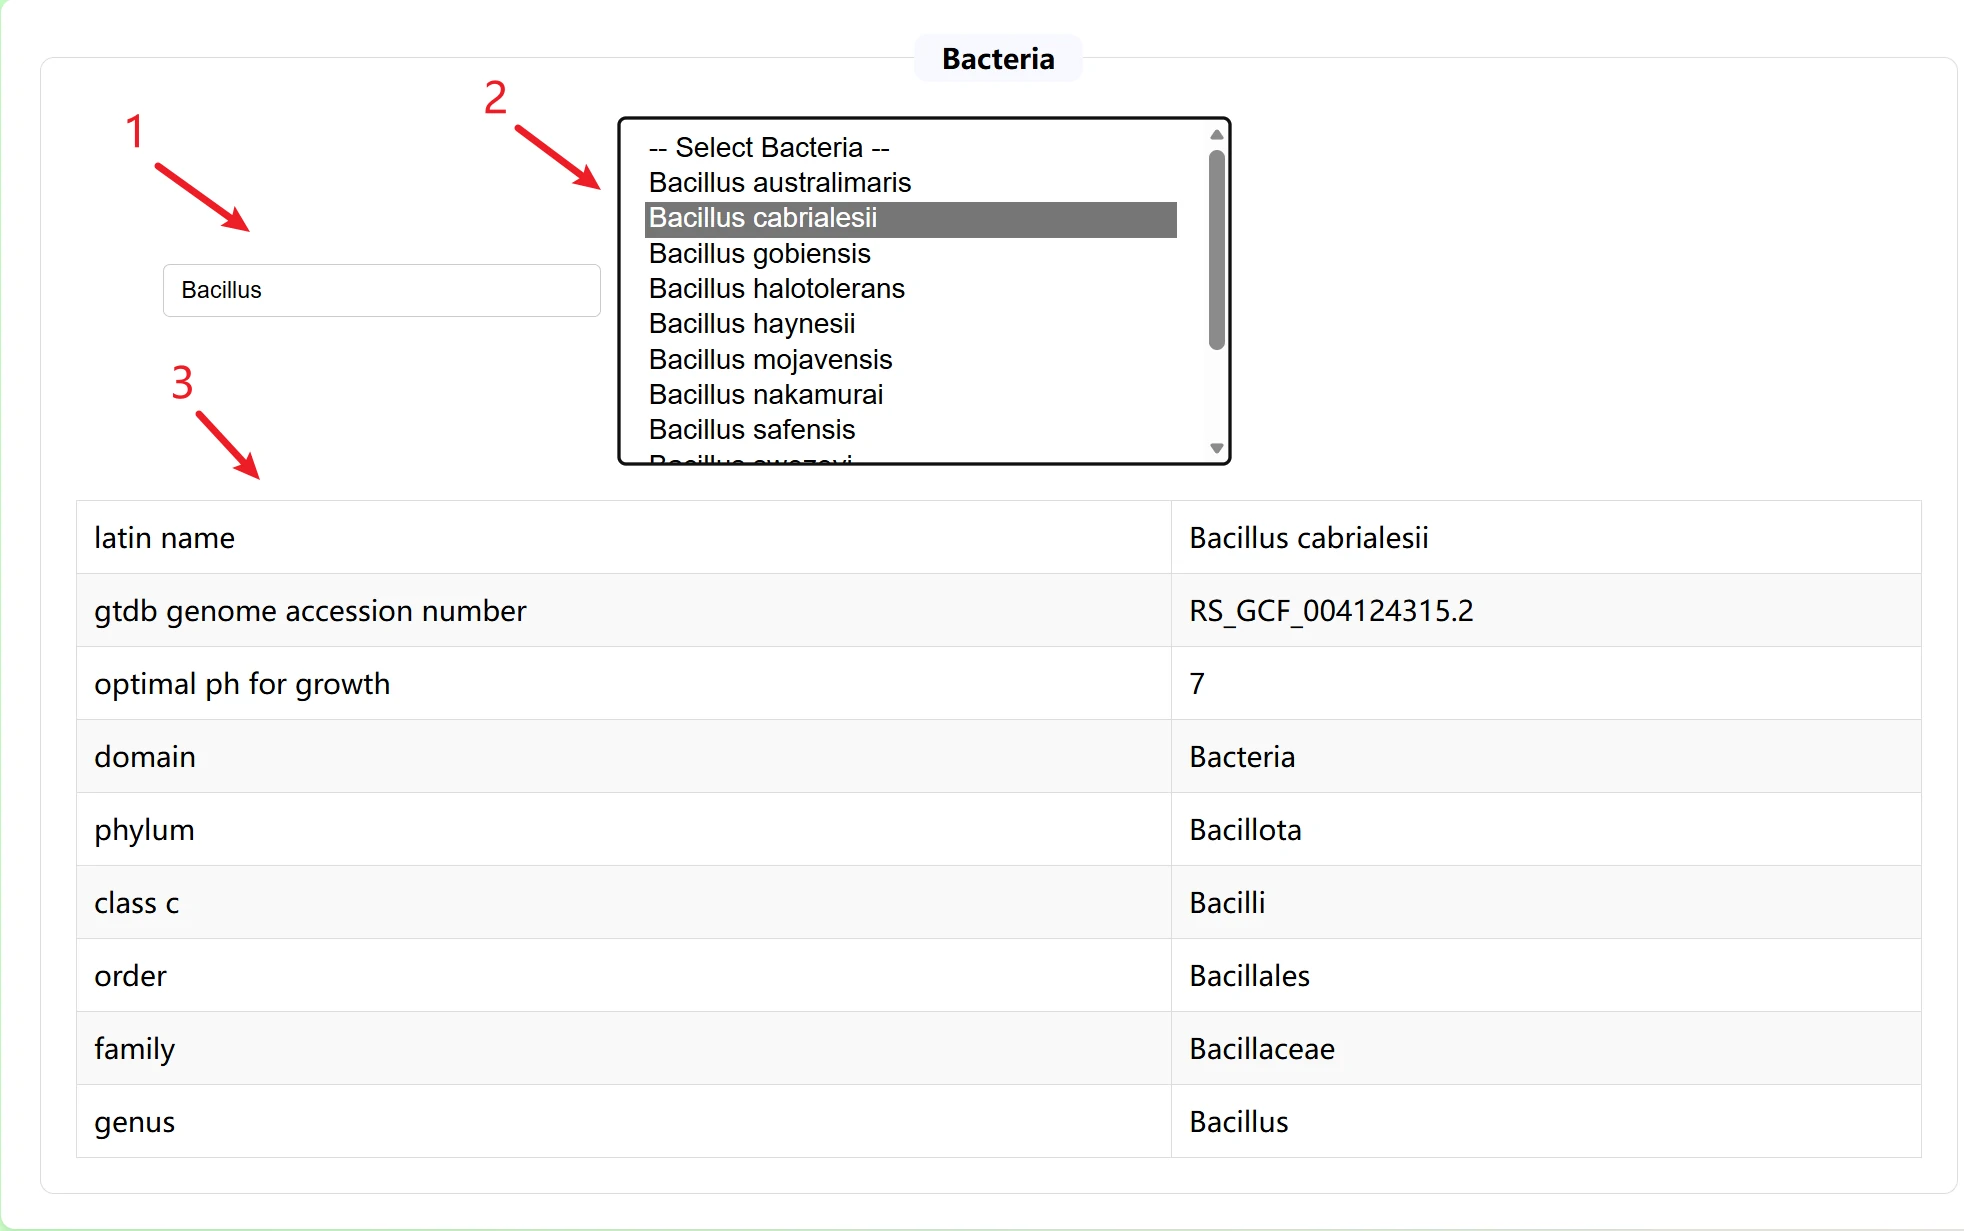
This is a detailed information query page for silage microorganisms (bacteria/archaea). It is primarily used to retrieve the genomic and biological attributes of silage-related microorganisms, serving as a fundamental tool for research on silage microbial functions.
The page is divided into three professional retrieval modules according to microbial types, covering all microbial groups:
Each module is independently retrieved and does not interfere with each other, which is convenient for targeted screening of microbes.
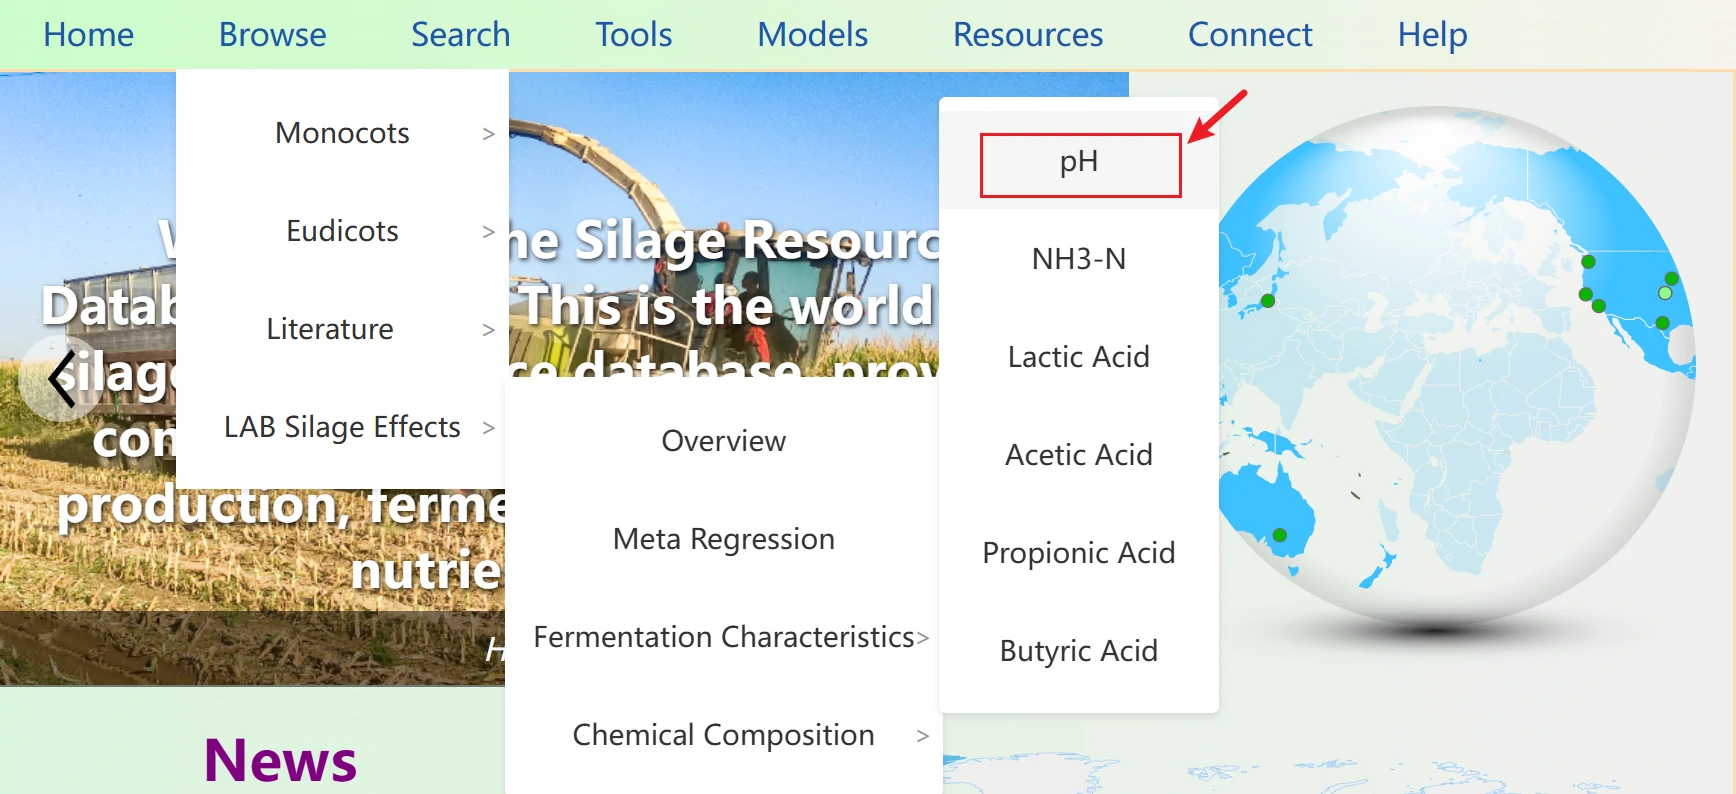
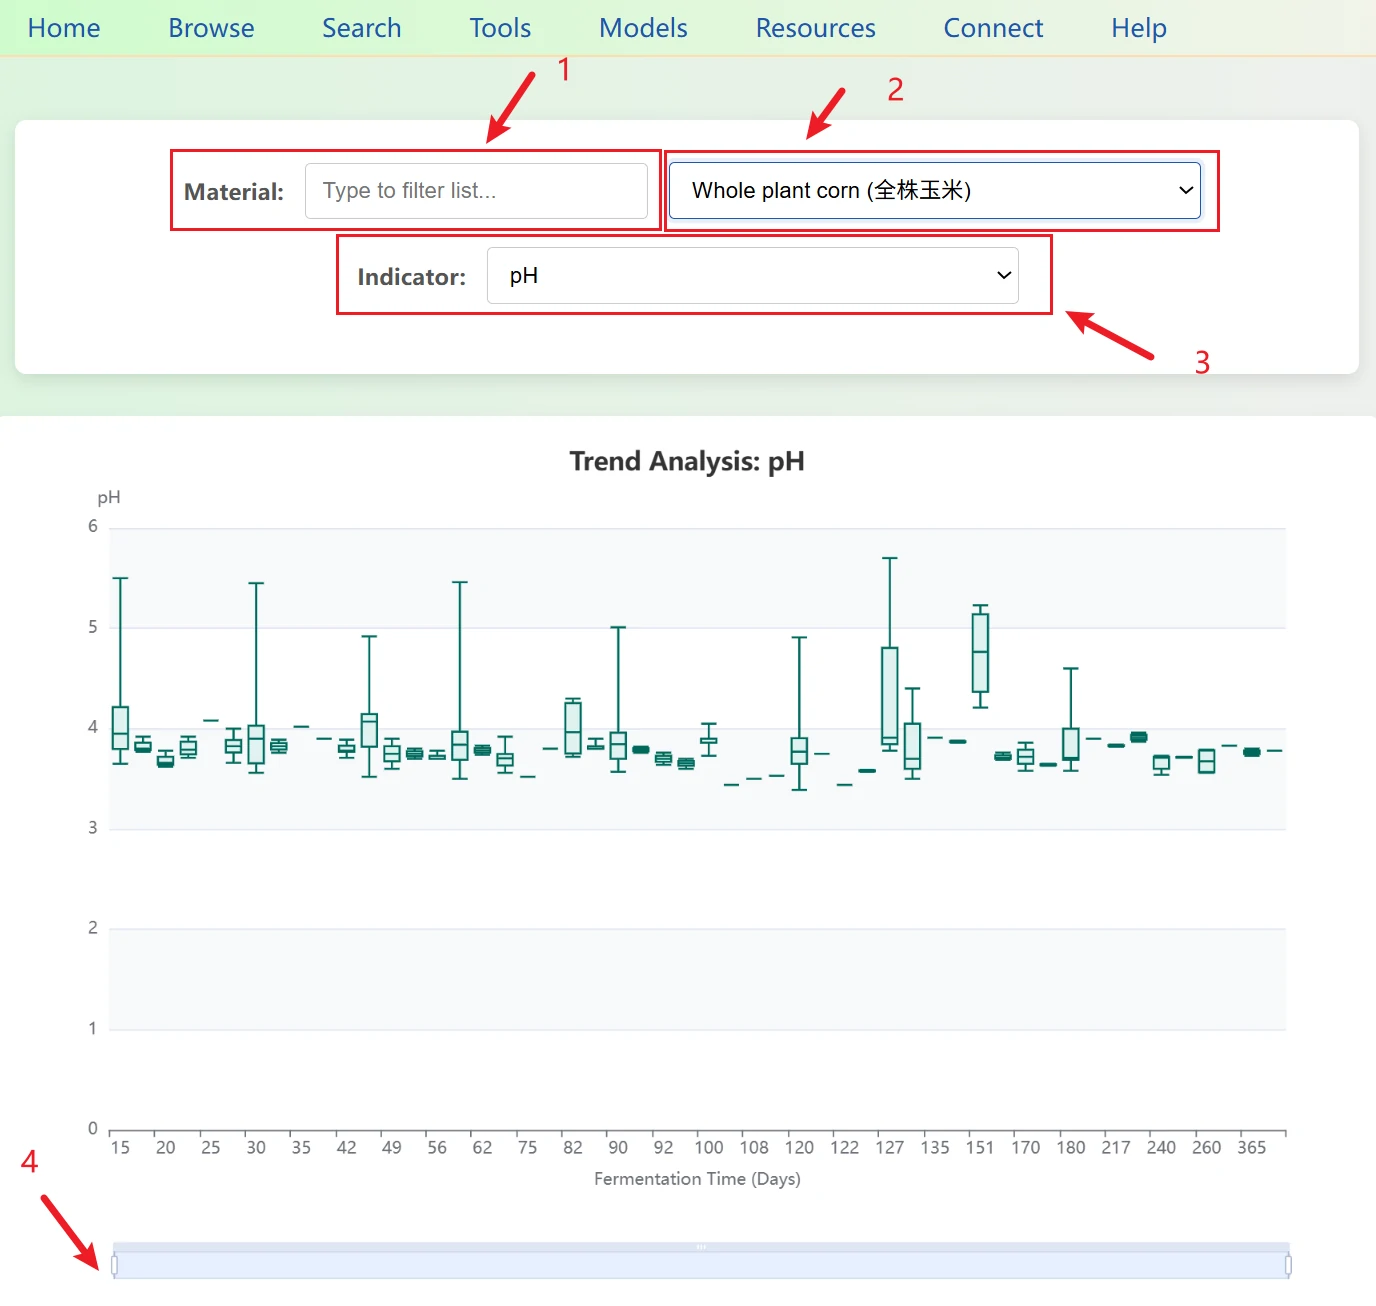
4. Fermentation Timeline1. A text input box is provided on the left. Since the database may contain hundreds of forage types (such as Corn, Alfalfa, Oat, etc.), users can directly enter keywords (e.g., "Corn").
2. As the user types, the dropdown menu on the right filters in real time, displaying only options that contain the keyword, greatly improving search efficiency. The dropdown menu is formatted as {English Name} ({Chinese Name}) for easy bilingual selection.
3. The interface supports switching among 12 core fermentation indicators, including pH, NH3-N, Lactic acid, and Dry matter.
4. When hovering the mouse over a box plot, a tooltip displays the specific five statistical values. Given that fermentation periods can be very long (from Day 1 to over 100 days), a sliding zoom bar is provided at the bottom. Users can drag the slider to focus on a specific time period (e.g., viewing only changes in the first 7 days) or use the mouse wheel to zoom.
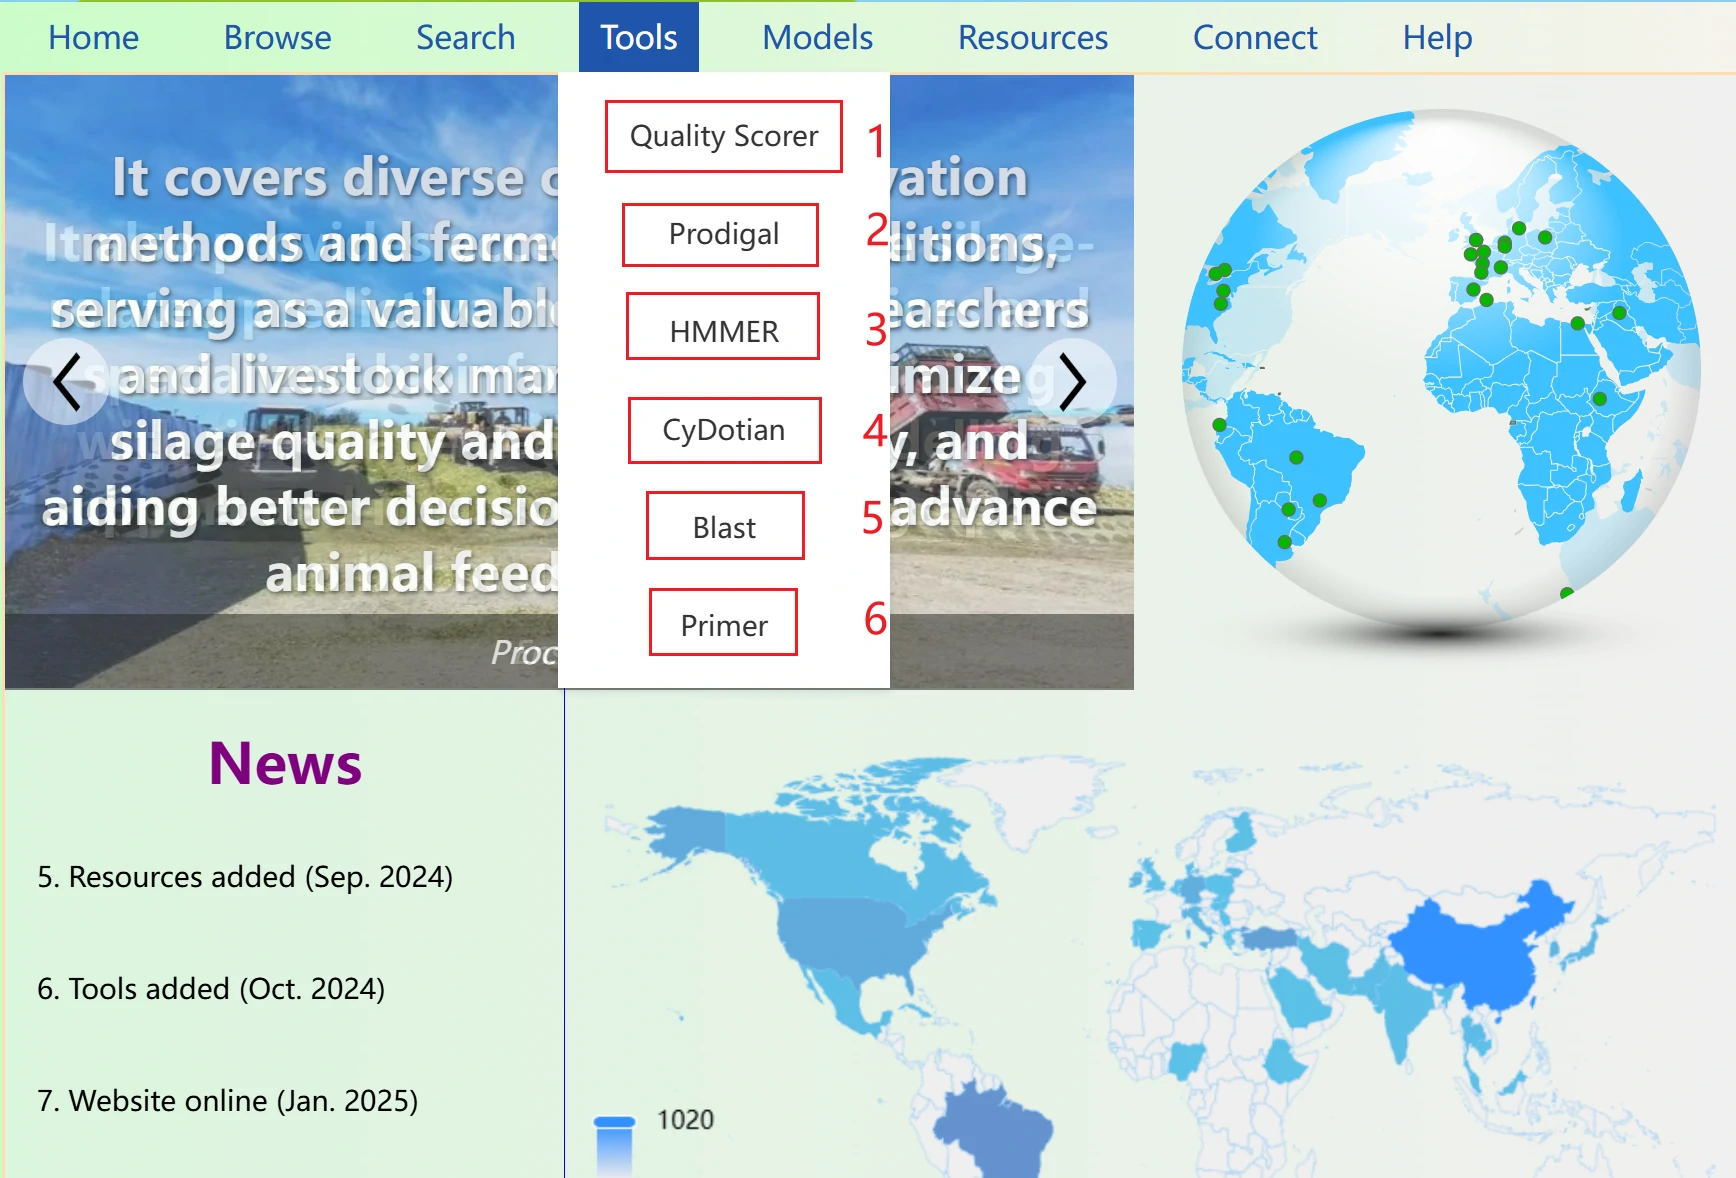
Our platform integrates a comprehensive set of bioinformatics tools tailored for silage research, covering sequence analysis, microbial profiling, and silage quality evaluation. Key tools include Blast for sequence alignment, Primer Design for specific primer development of silage-related microbial functional genes, and Prodigal for gene prediction in microbial genomes.
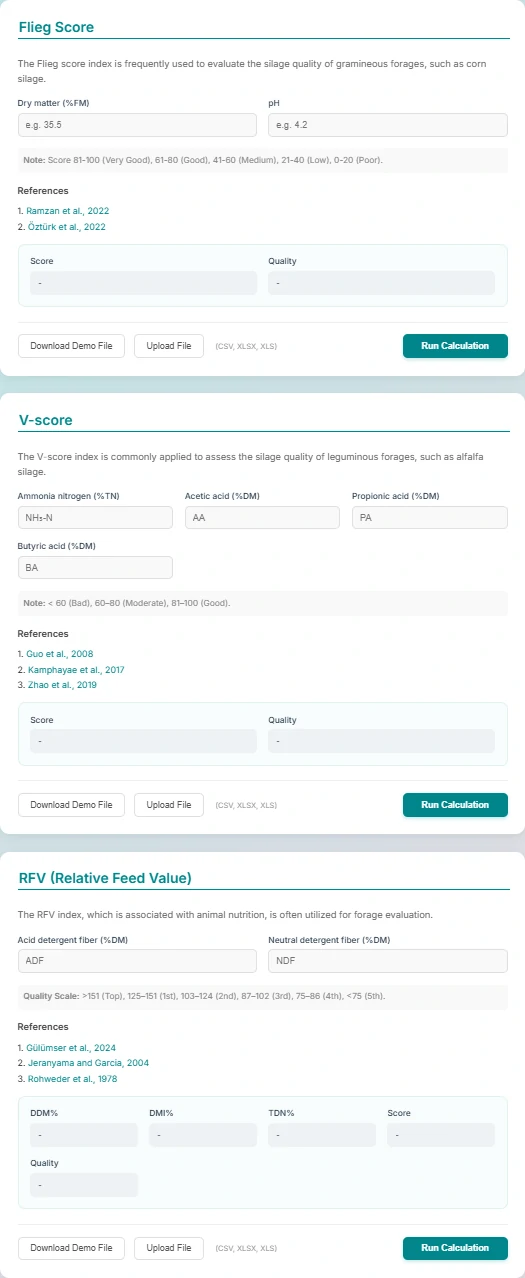
This page is a practical silage quality evaluation tool that integrates three mainstream international silage quality scoring standards. It supports quick calculation and grade judgment of silage quality by inputting corresponding indicators, and is applicable to different types of silage raw materials such as gramineae and leguminous forages.
1. Flieg Score
Suitable for gramineous silage such as corn. Calculate the score only by inputting Dry Matter (DM) and pH value, and judge the quality level according to the international scoring interval (81-100 for excellent, 61-80 for good, etc.).
2. V-score
Specially for leguminous silage such as alfalfa. Input fermentation indicators including ammonia nitrogen, acetic acid, propionic acid, butyric acid, etc. to get the score, and divide the quality into three grades: poor (<60), medium (60-80) and excellent (81-100).
3. RFV (Relative Feed Value)
A forage evaluation index associated with animal nutrition. Input Acid Detergent Fiber (ADF) and Neutral Detergent Fiber (NDF) to calculate the value, and evaluate the feeding value of silage according to the professional interval (>151 for top grade).
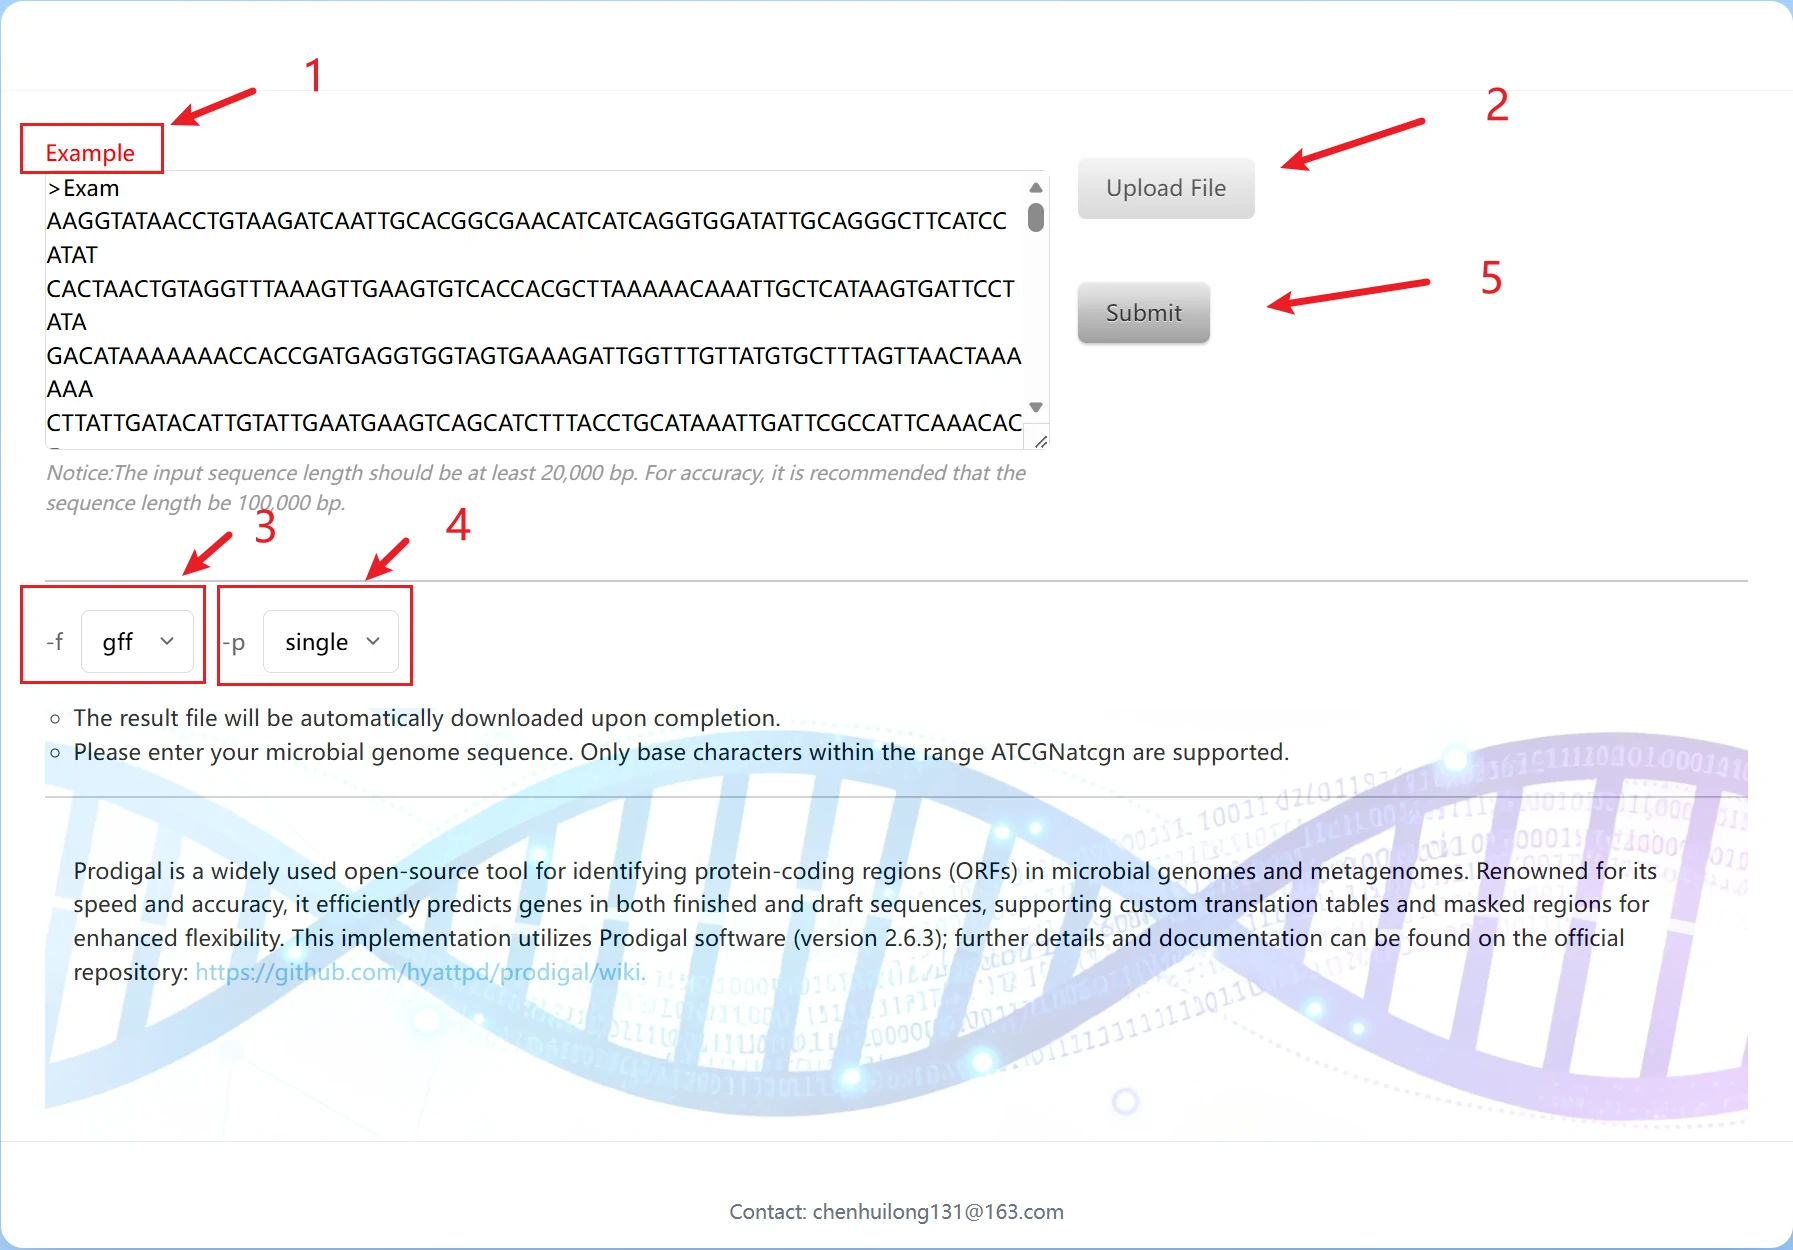
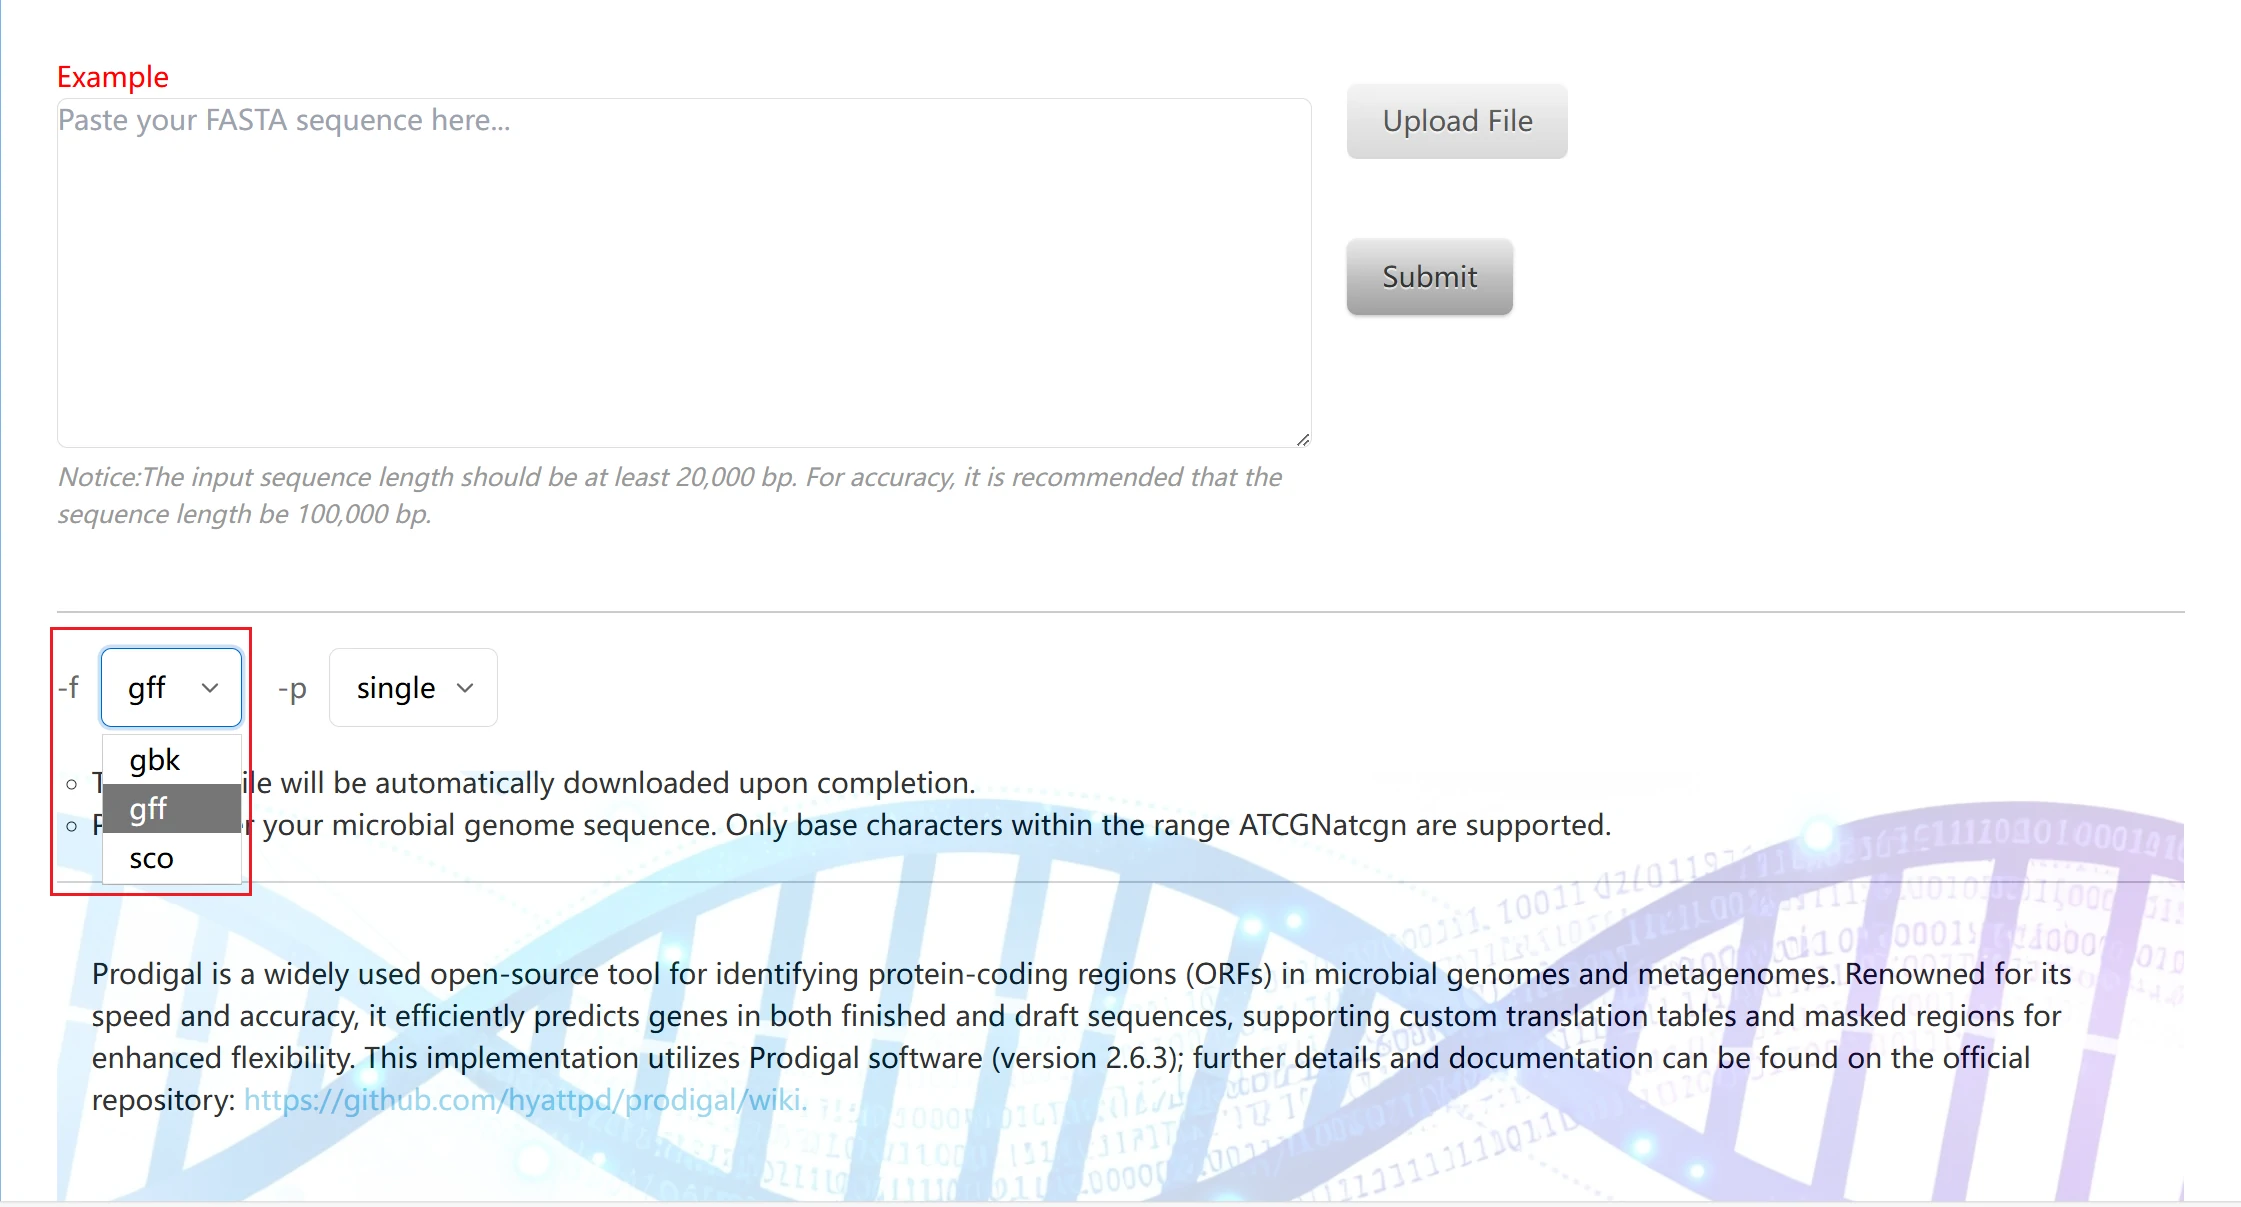
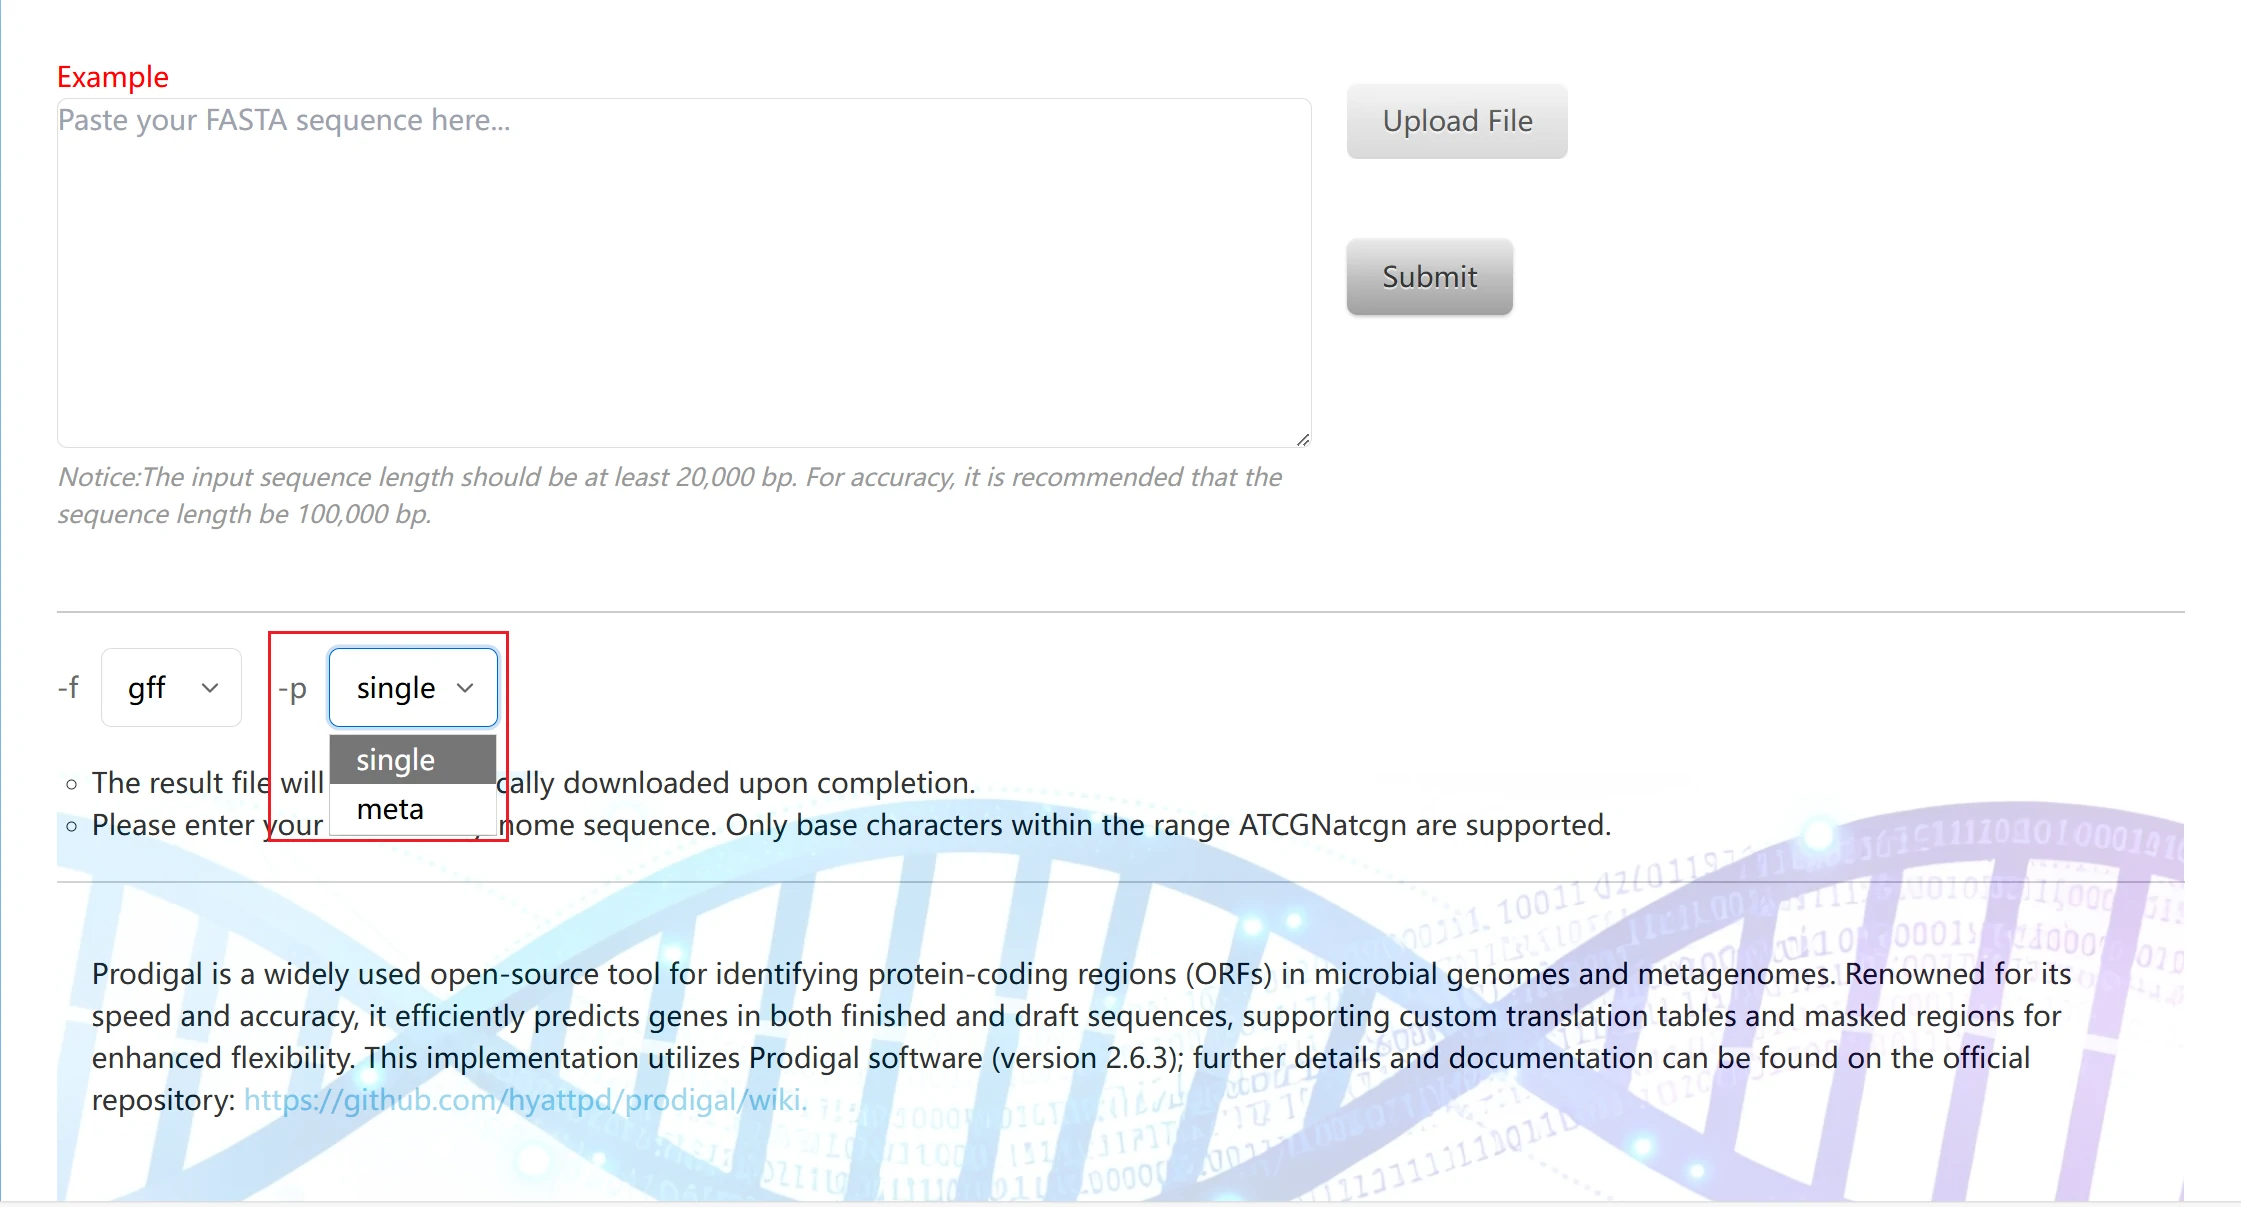
This is the Prodigal gene prediction tool page, designed for automatic identification of protein-coding regions (ORFs) in microbial genomes. It is a commonly used tool for functional gene analysis of silage microorganisms:
1. You can directly paste the genomic sequence or click "Example" for reference.
2. You can upload a file for import. Please note that the file format must be .fasta, .fa, or .fna.
3. Result format parameters are used to specify the output format of gene prediction results. Three common biological data formats are available: gff, sco, and gbk.
4. single: Suitable for single-genome sequences of pure-culture silage microorganisms (e.g., genomes of individual silage bacteria/archaea). The tool first performs targeted training on the input sequence to improve the accuracy of gene prediction; meta: Suitable for metagenomic mixed sequences from silage samples (e.g., mixed genomic sequences of multiple microorganisms in a silage system). It skips the separate training step and uses a pre-trained model for fast prediction, adapting to sequence analysis of mixed microbial communities.
5. Click "Submit" to start the run. After completion, the result package will be automatically downloaded.
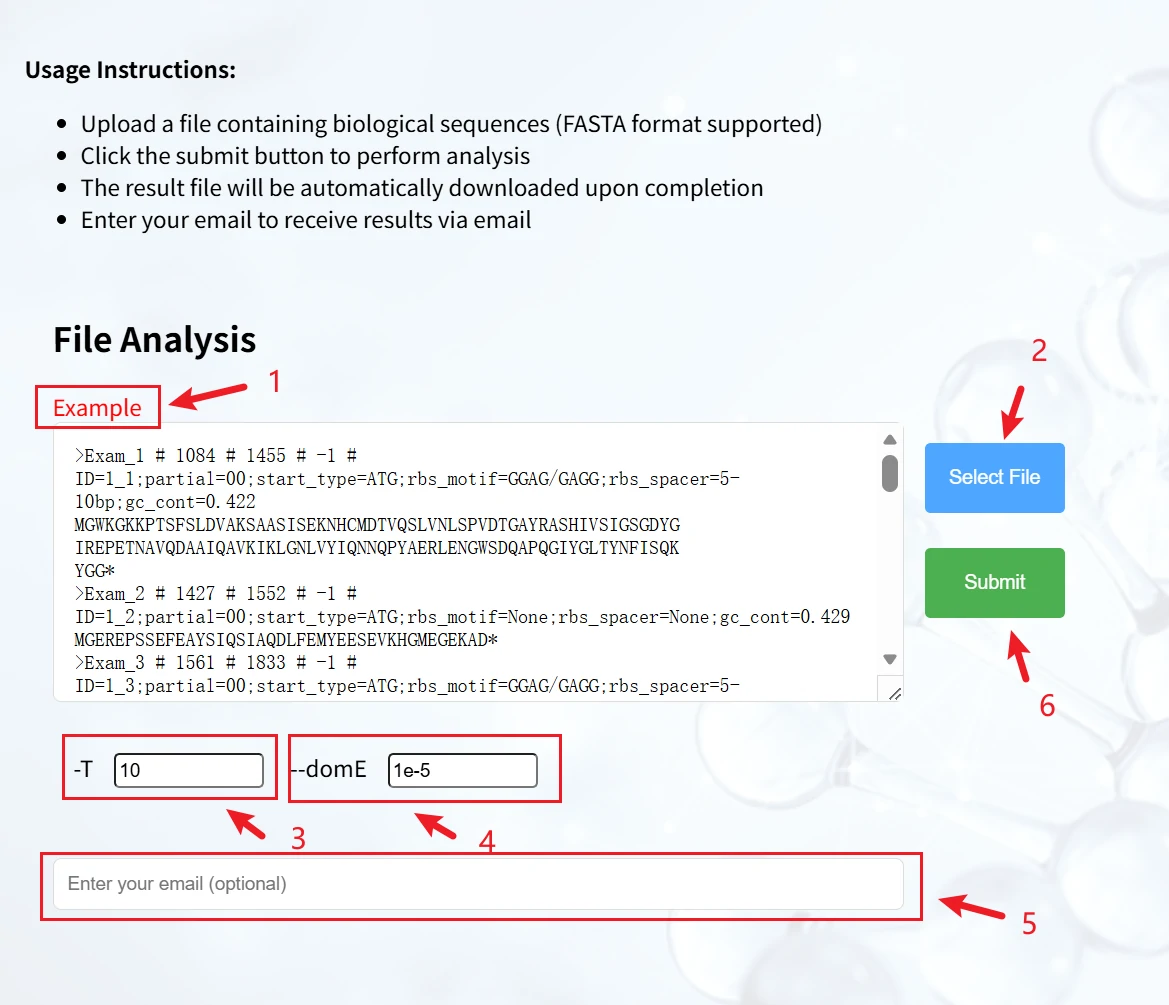
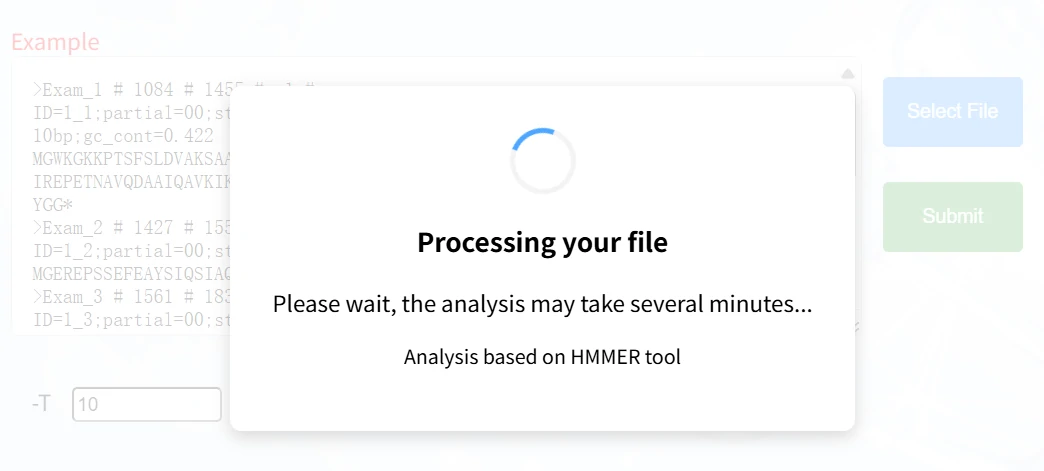
This is a biological sequence analysis page based on the HMMER tool, used for analyses such as domain identification on protein/nucleic acid sequences in FASTA format. It features a clear workflow and supports flexible parameter settings.
1. Sequence input: You can directly paste a FASTA-formatted sequence into the text box (with an example provided for reference).
2. Click "Select File" to upload a local FASTA file.
3. -T: Sets the E-value threshold for sequence analysis (default: 10), used to control the stringency of results.
4. --domE: Sets the E-value threshold for domains (default: 1e-5), used to filter significant domain matches.
5. You may enter an email address (optional). After analysis completes, results will be automatically downloaded; you can also receive them via email.
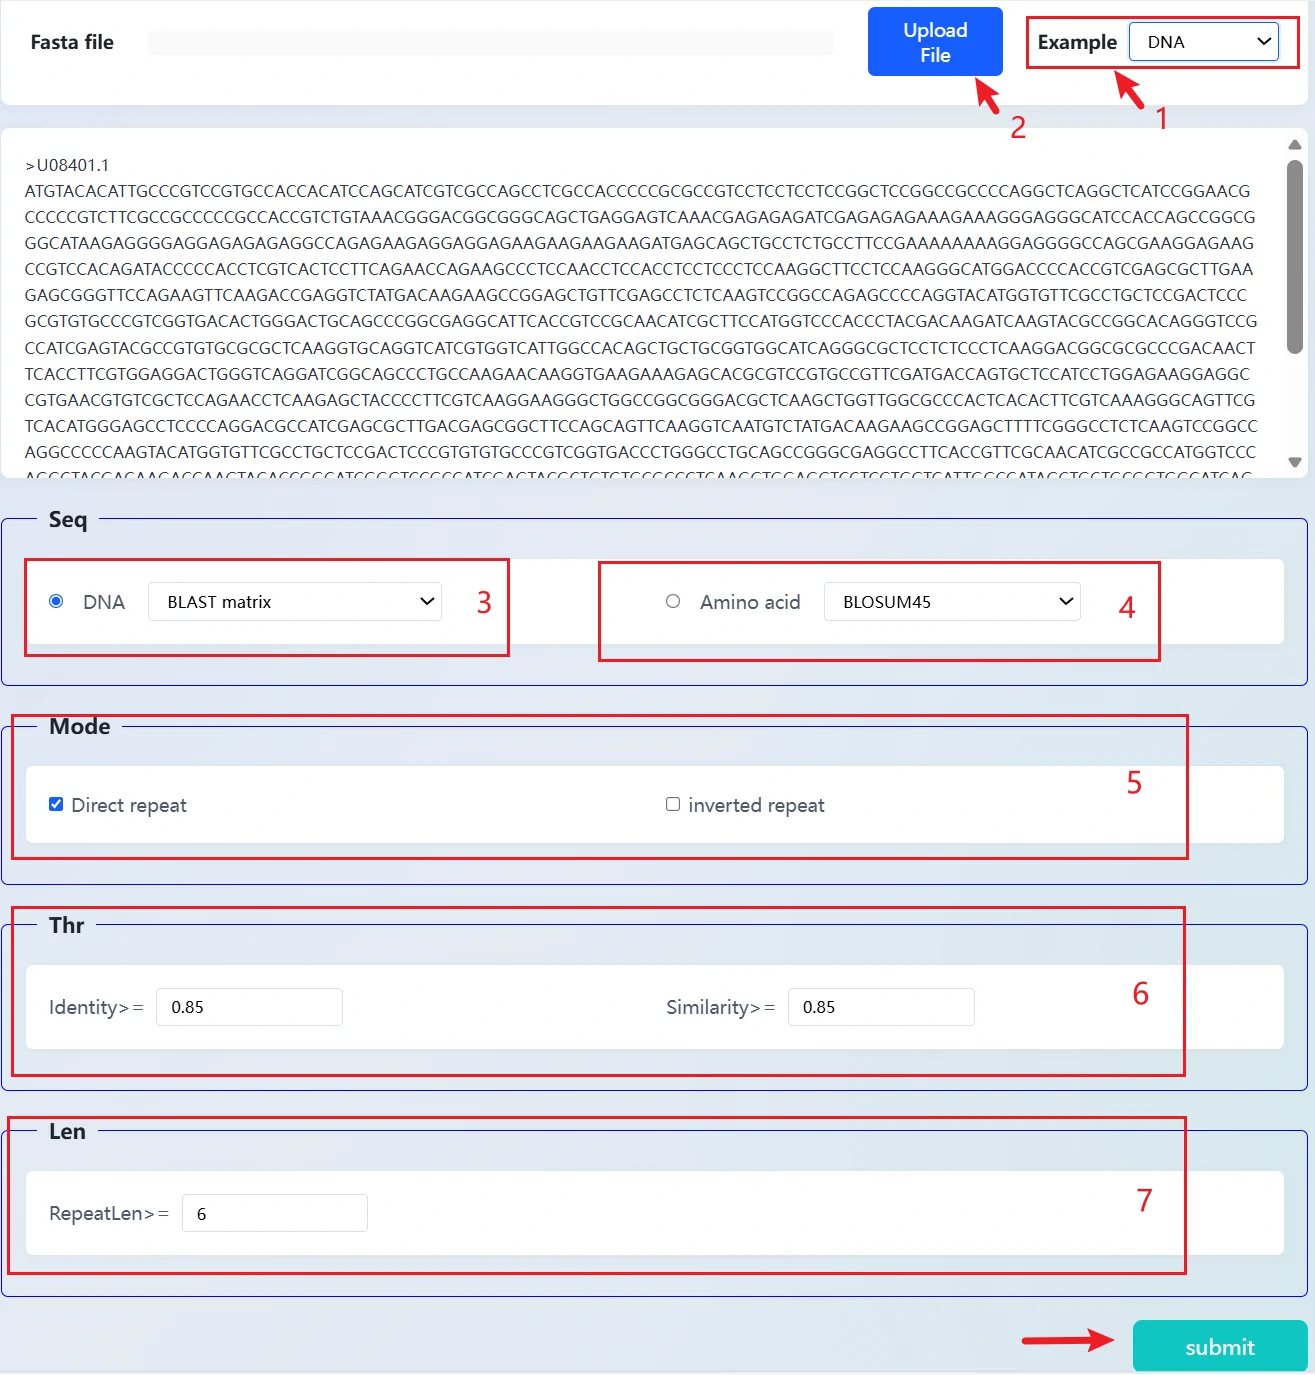
This is our developed repeat sequence analysis tool, designed to identify repeat fragments in FASTA-formatted sequences. It supports both DNA and amino acid sequence types, with user-friendly operation and flexible filtering criteria.
1. Sequence input: You can directly paste the sequence, upload a file, or load an example sequence to start the analysis quickly.
2. Sequence type: Supports both DNA (with BLAST matrix) and amino acid (default BLOSUM45 matrix) modes.
3. Analysis mode: You can choose to identify direct repeats or inverted repeats.
4. Filtering criteria: Thresholds for identity, similarity, and minimum repeat length (RepeatLen) can be set to precisely filter results.
5. Submit analysis: After completing the settings, click "submit" to identify and output the target repeat sequences according to the criteria.
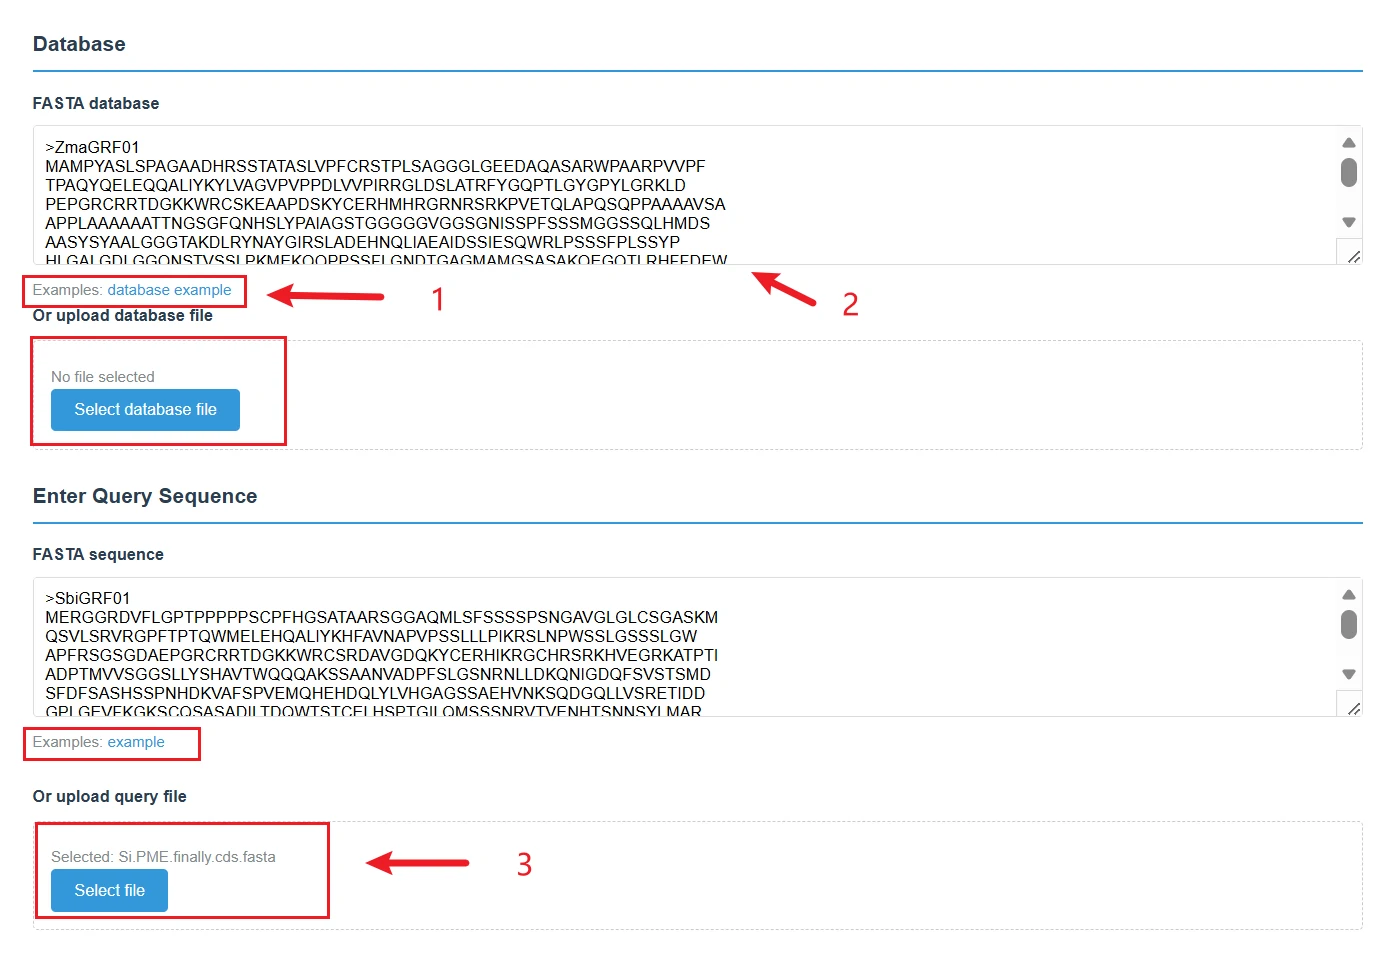
This is a BLAST sequence alignment analysis page, used to perform homology alignment between query sequences and database sequences. It is a core tool for the homology analysis of silage microbial genes.
sequence input, you can directly paste FASTA-formatted database sequences into the text box, or click "Select database file" to upload a local database file. Click "database example" to load a sample database sequence and quickly familiarize yourself with the format requirements.
Query Sequence InputYou can directly paste the query sequence in FASTA format into the text box, or click "Select file" to upload a local query file.Click "Examples: example" to load a sample query sequence for quick testing.
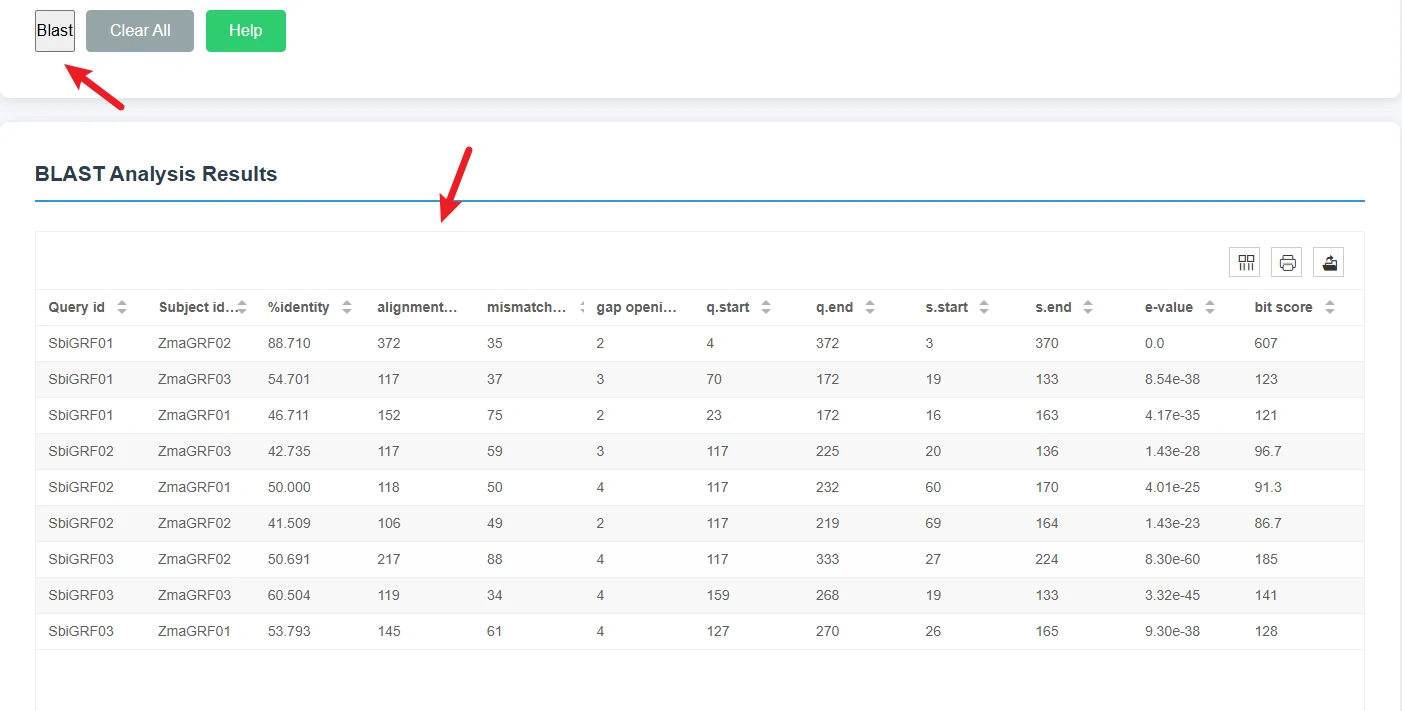
Submission and Results DisplayClick the Blast button in the upper left corner to start the alignment analysis;Once the analysis is complete, the page will display detailed results in a table format.
You can also leave your email address, and we will notify you by email when the analysis is complete.
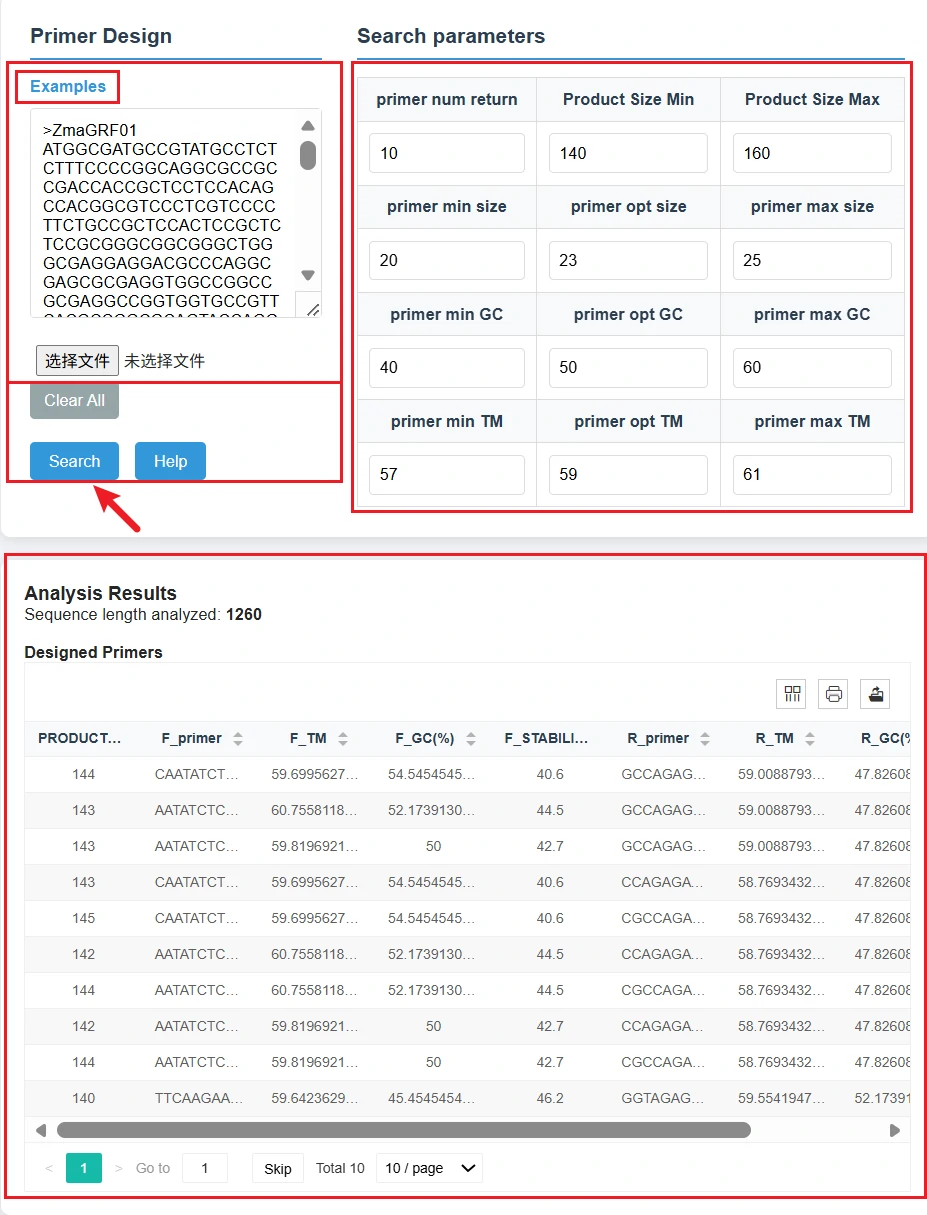
This page is a practical tool for automatic PCR primer design in target DNA sequences, which can generate primer pairs meeting experimental requirements and provide reliable design schemes for gene amplification, detection and cloning experiments of silage microbes.
1. Sequence Input
Paste the FASTA format target sequence directly into the text box, or upload the local sequence file by clicking the file selection button; click Examples to load the sample sequence for quick start, and click Clear All to empty the input with one click.
2. Custom Search Parameters
Set the experimental screening criteria of primers according to research needs:
3. Intuitive Result Display
Click the Search button to start the primer design. After the analysis is completed, the page displays the designed primer pairs in the form of a table, including key information such as product length, upstream and downstream primer sequences, Tm value, GC content and stability. The results support pagination viewing and export for subsequent experimental use.


This section showcases a variety of resources we have collected online.
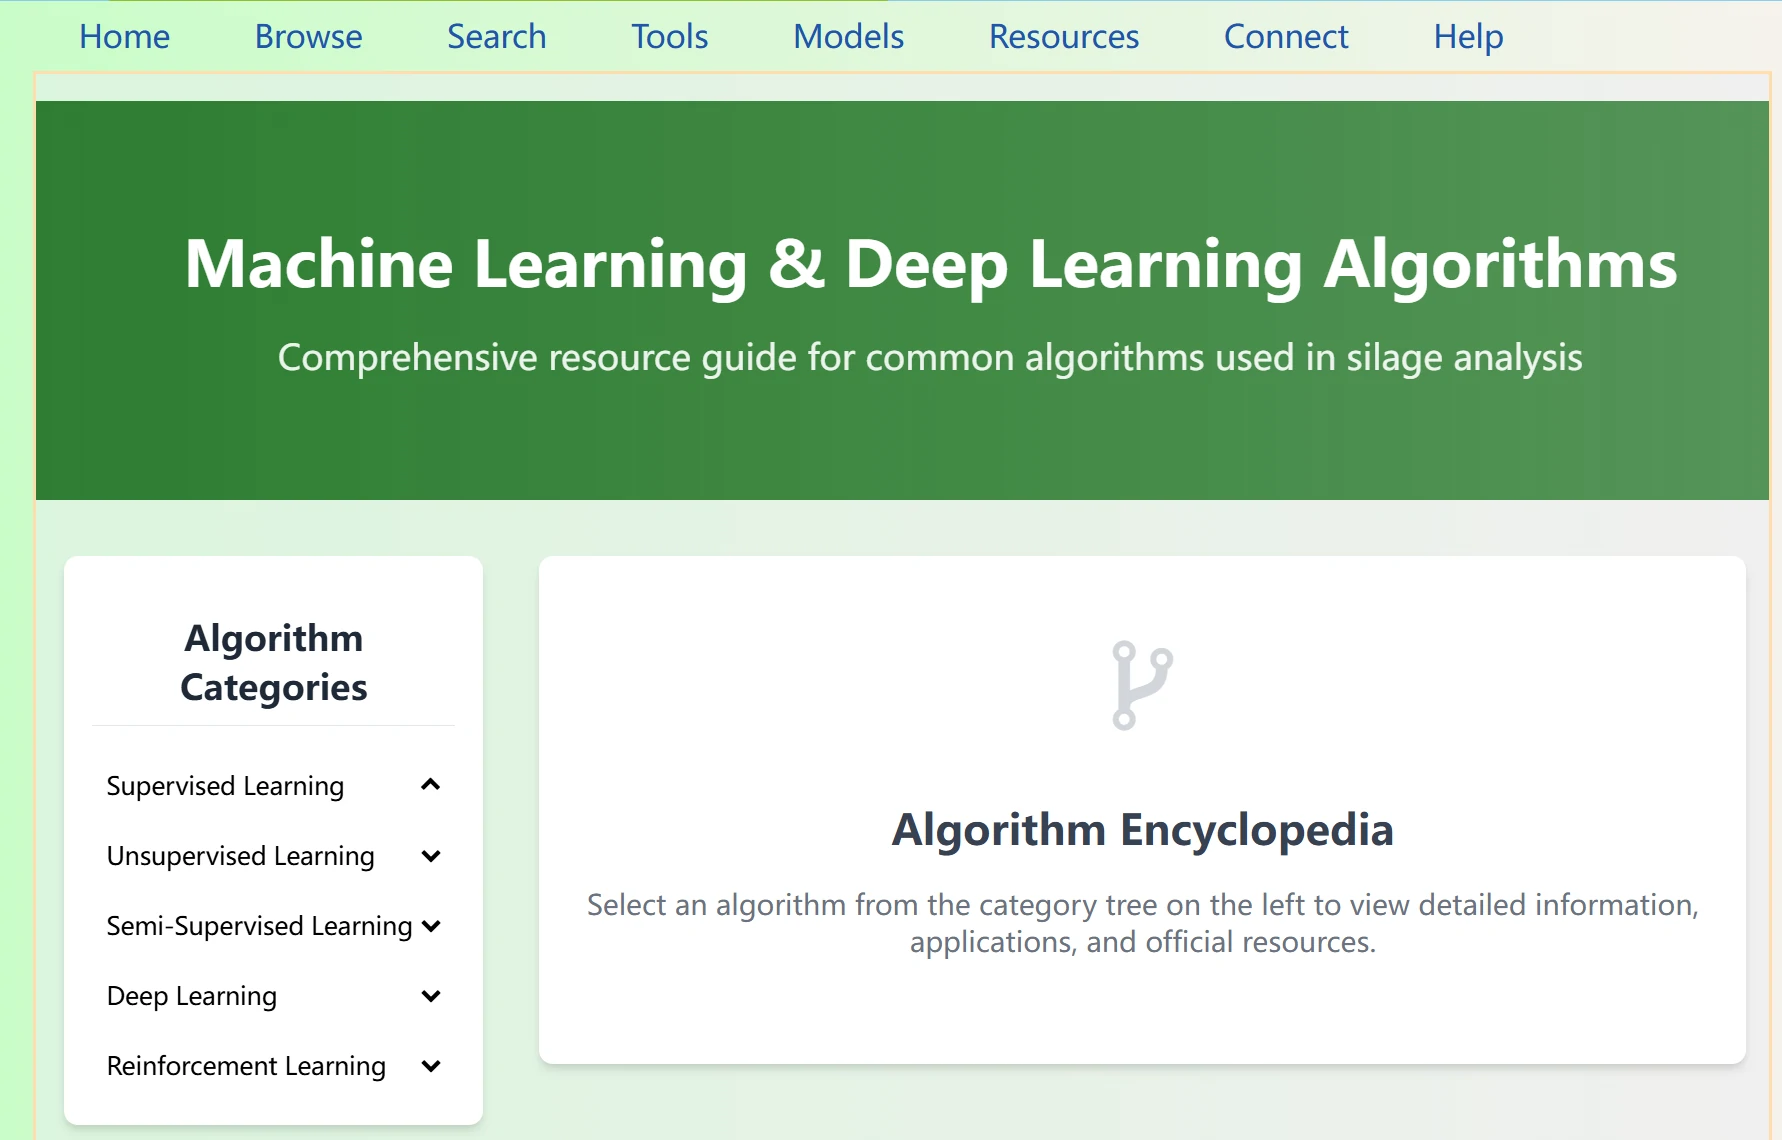
Algopedia for Silage is a dedicated encyclopedia page for machine learning and deep learning algorithms used in silage analysis. It provides structured algorithm references for silage researchers, helping them understand and apply common algorithms.
Popular AIcontains introductions and links to popular large AI models available on the market.
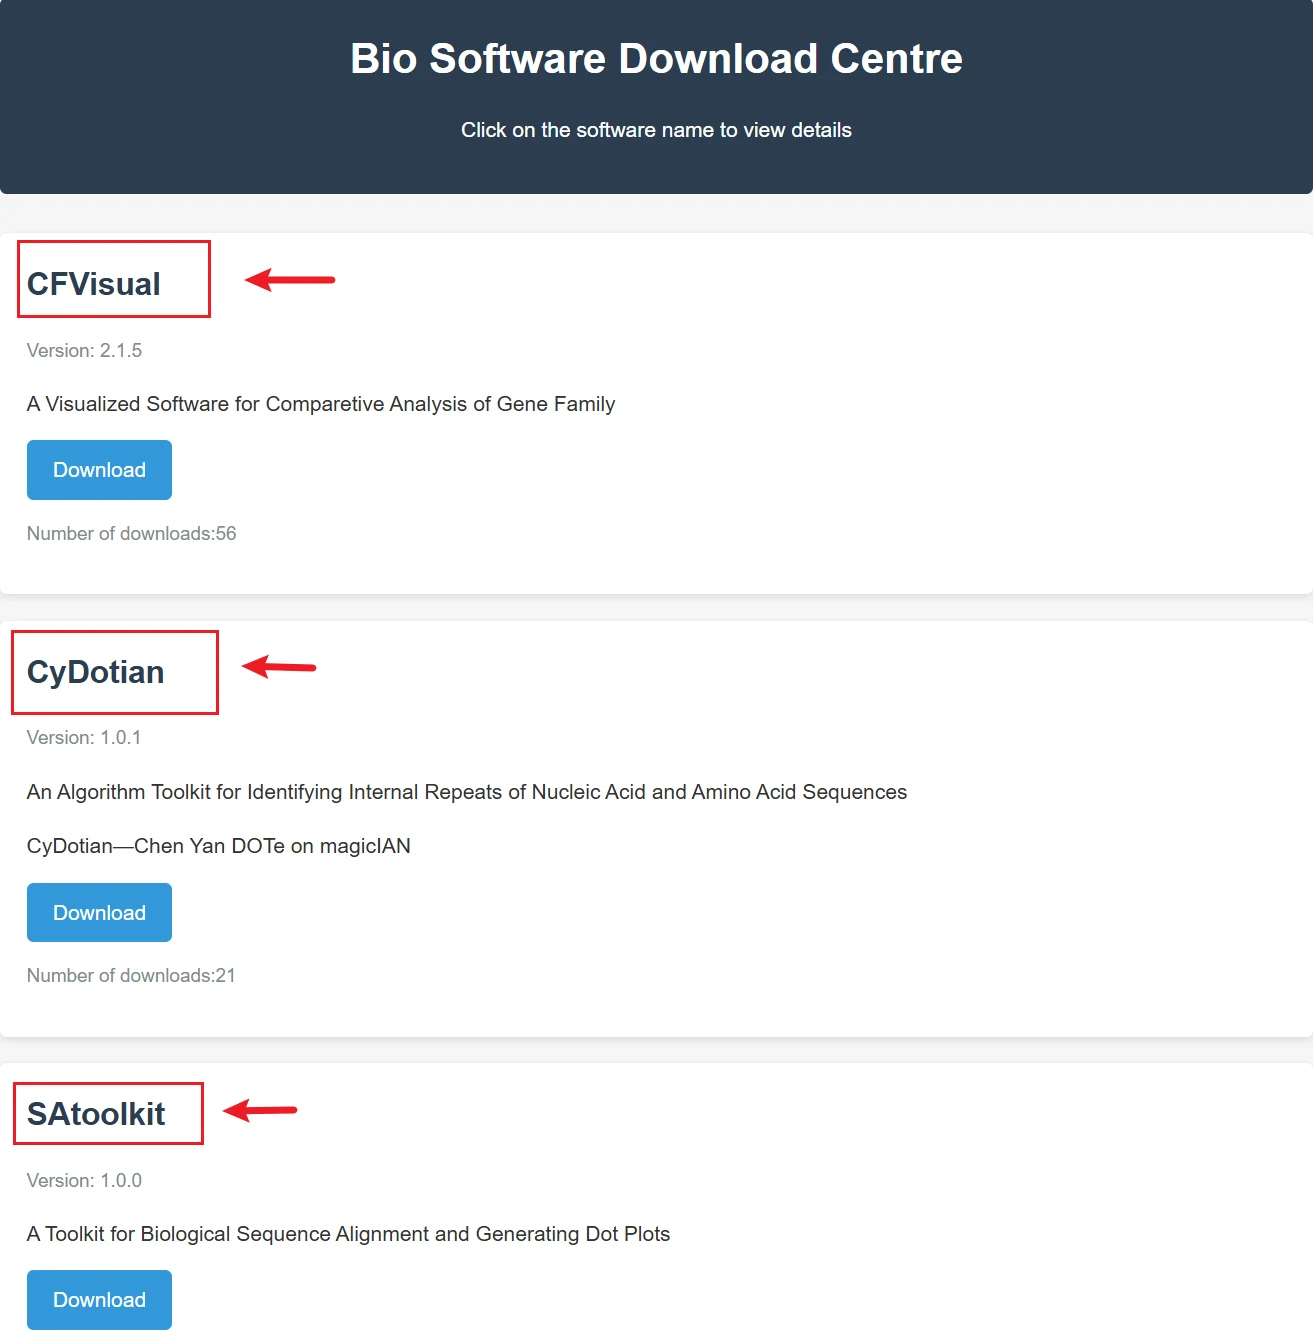
Bio-software offers download access and introduction pages for the bioinformatics tools we have developed.
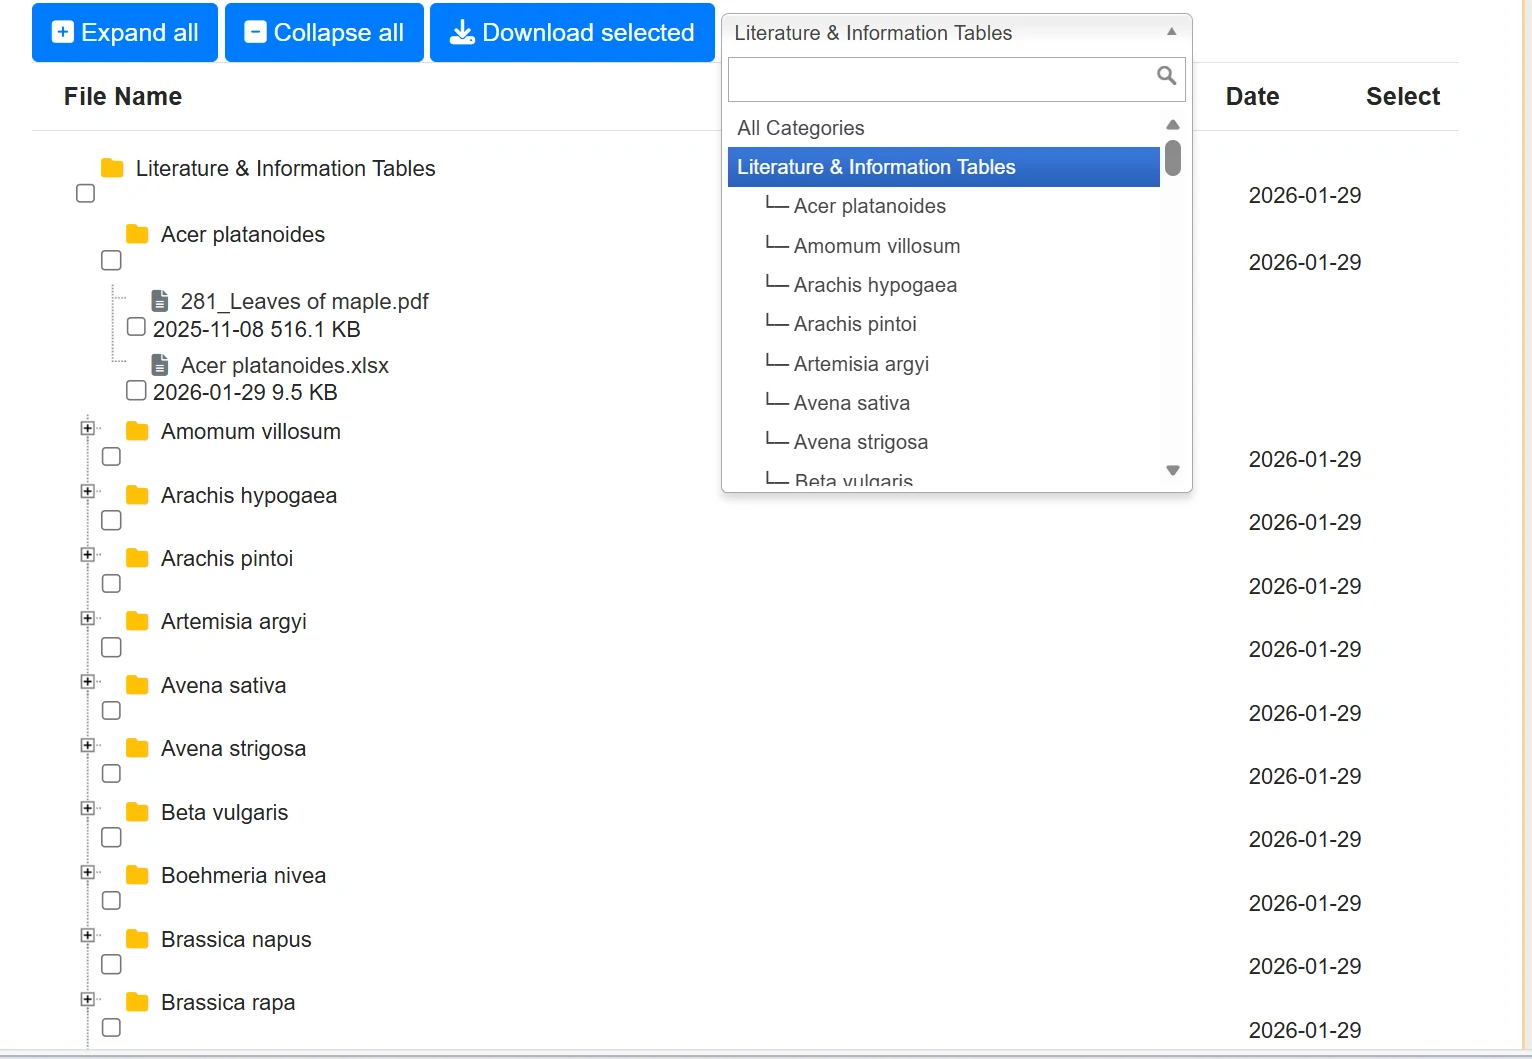
Silage Paper provides download links to relevant literature on silage materials we have collected. It supports searching for materials by Latin name and batch downloading of multiple files.
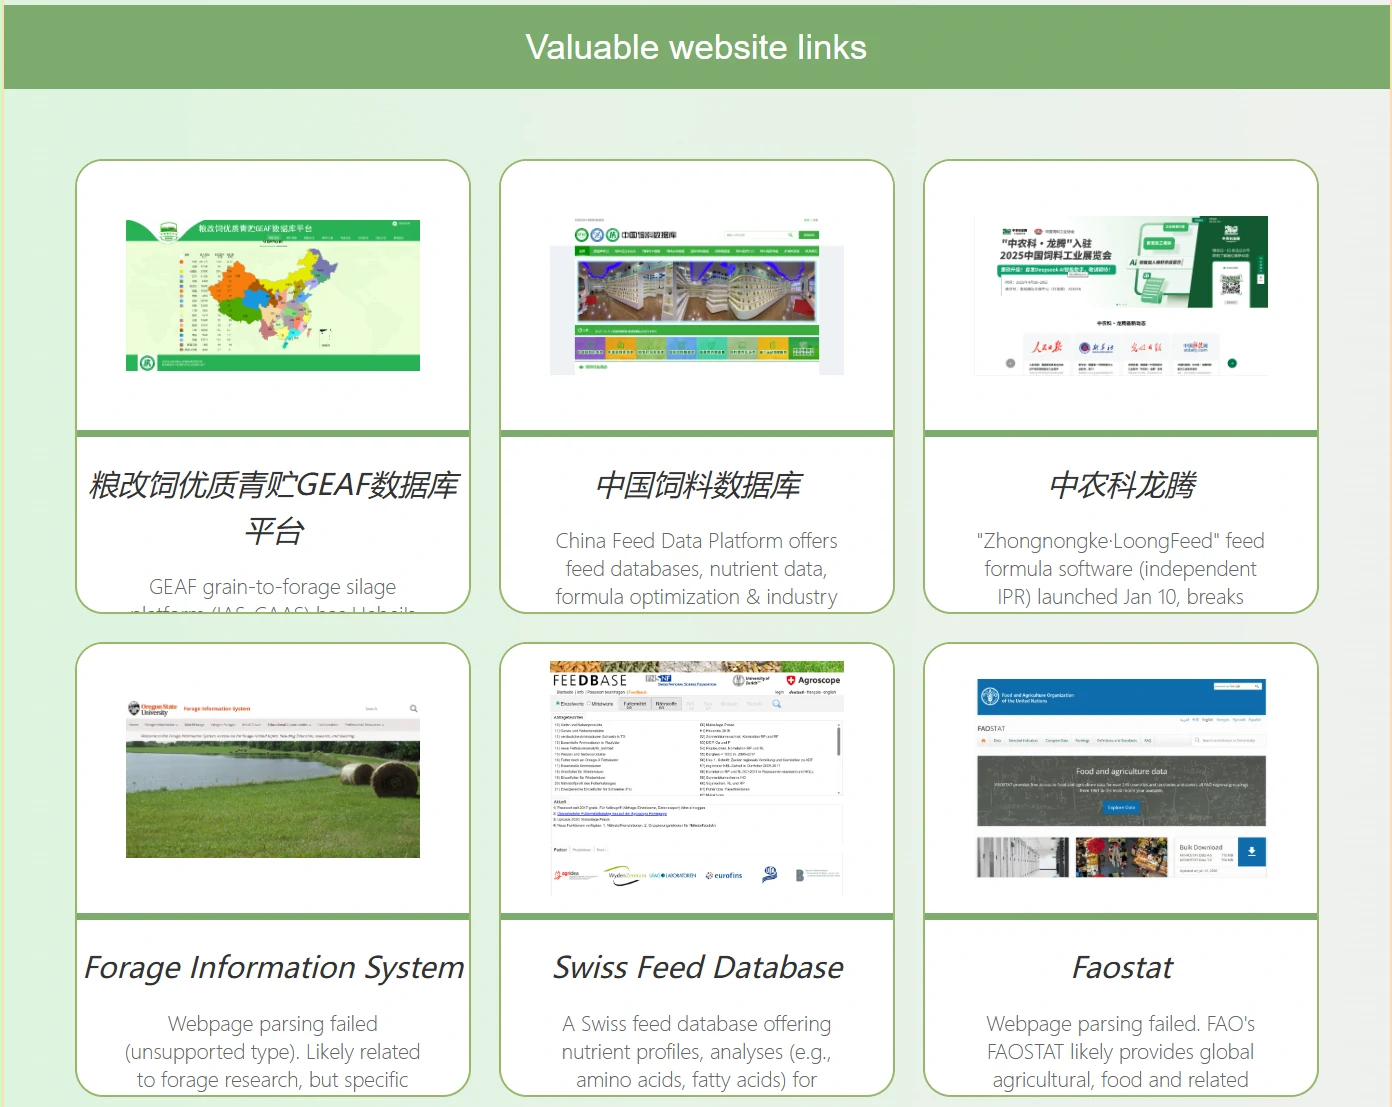
Website Resources lists valuable websites related to the silage field, with clickable images for direct access.
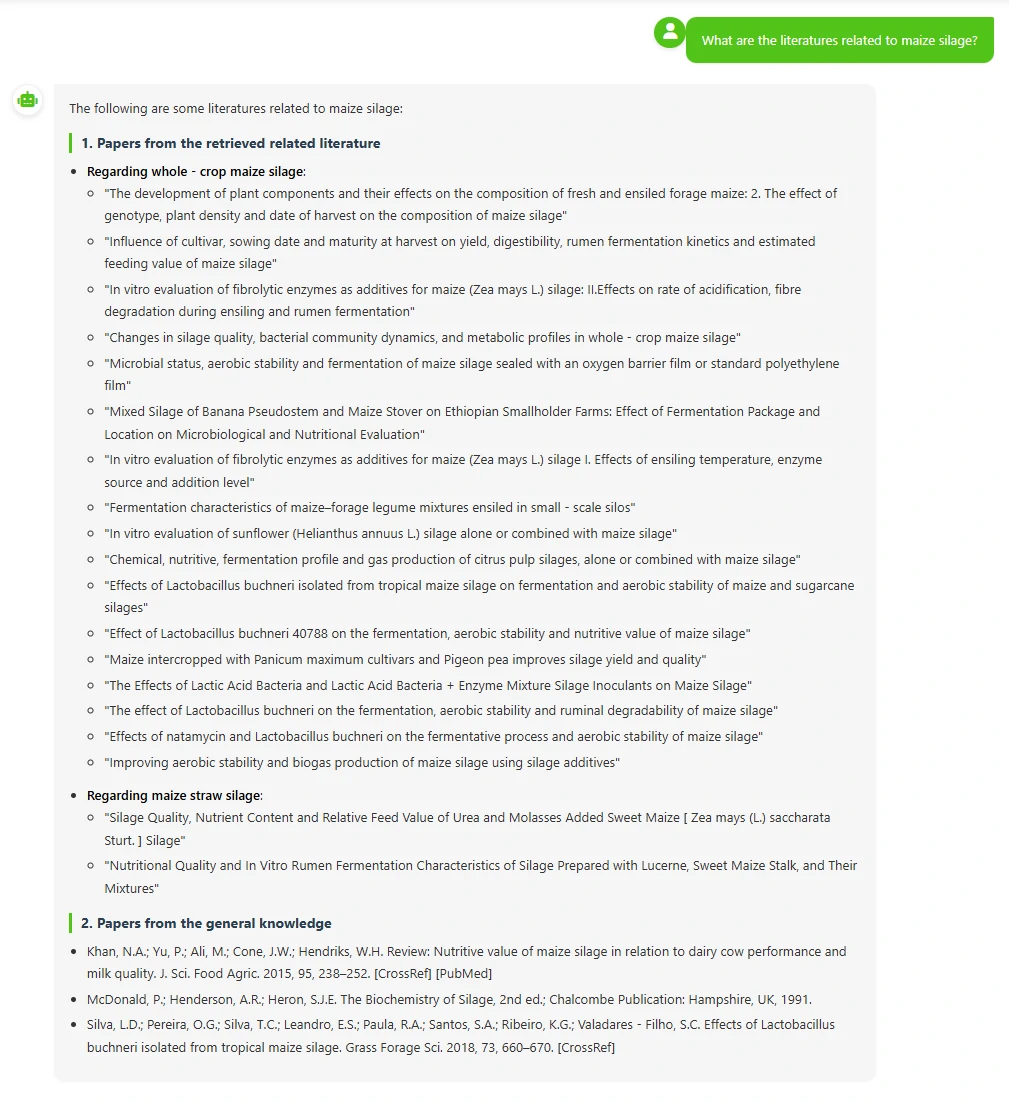
This is a silage intelligent agent connected to our database. It can help you retrieve information from the database—for example, you can ask it to introduce silage materials, inquire which literature used specific materials for silage, and learn about the silage procedures described in those papers.
If you have suggestions for our platform or would like to contribute relevant data in the field of silage, you are welcome to participate in our joint development through the following channels:
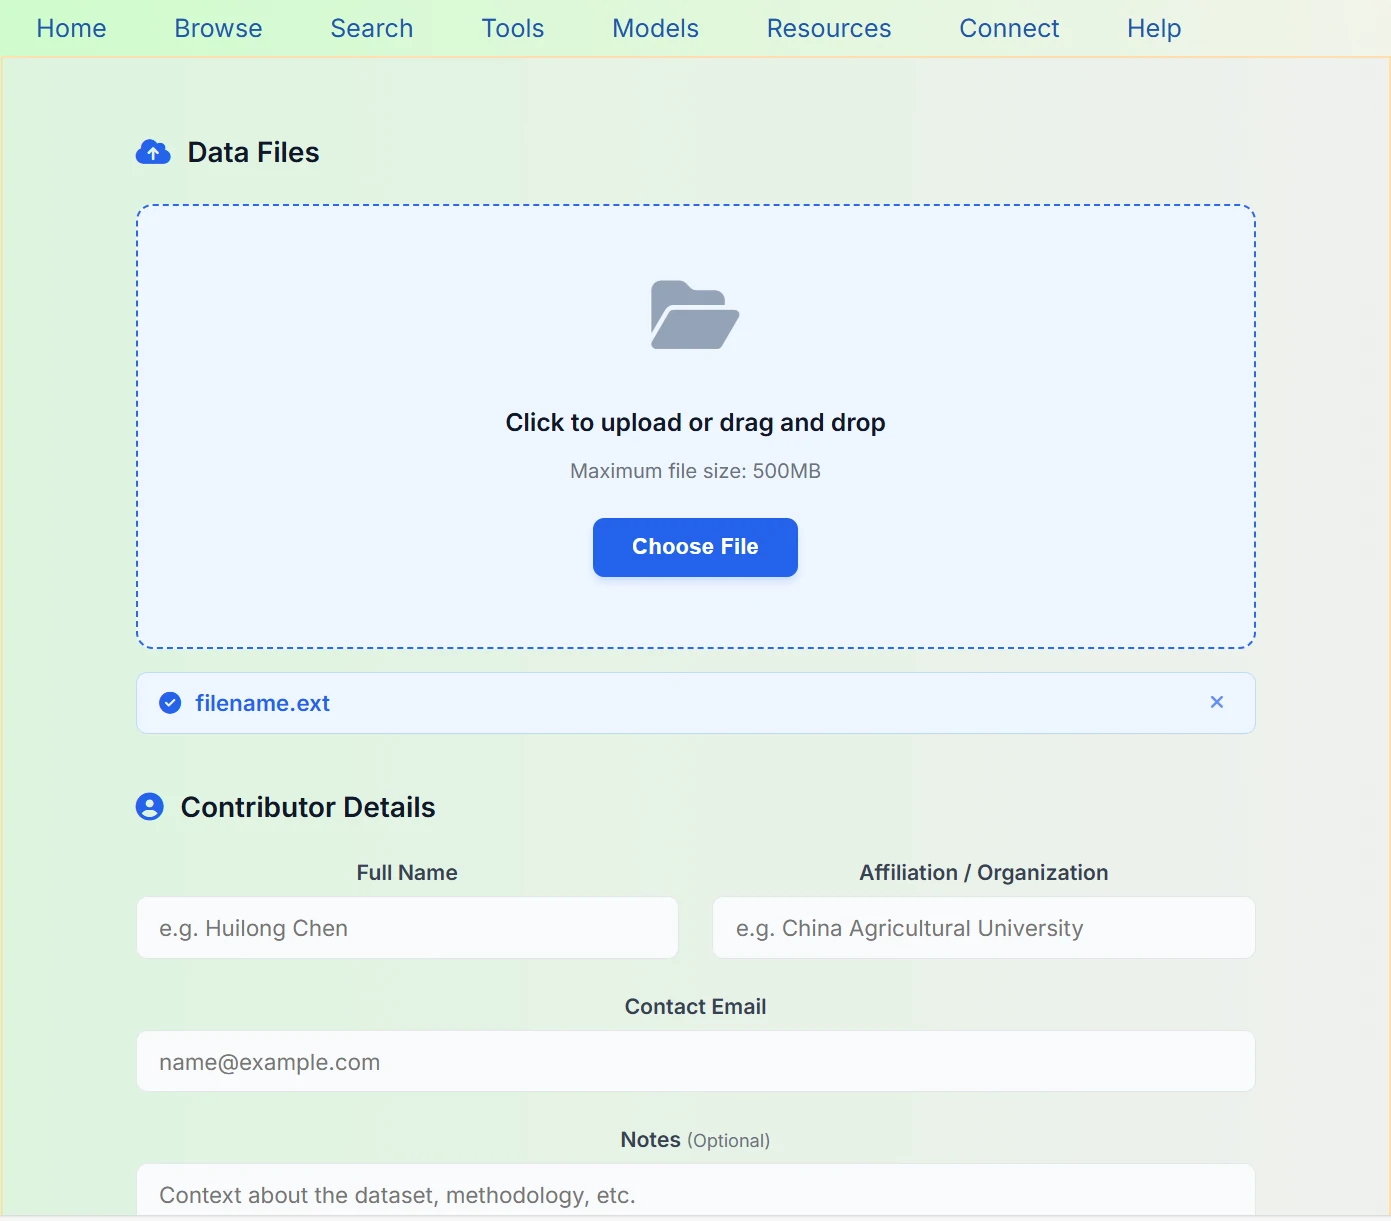
This is our silage research data sharing and upload platform, where you can conveniently upload and share silage-related datasets. The platform supports both click-to-upload and drag-and-drop uploads, with a maximum single file size limit of 500 MB. The contributor information you provide will ensure data provenance and academic integrity, facilitating citation and acknowledgment in subsequent research.
Every data contribution you make will advance open sharing and collaborative innovation in the field of silage research, helping researchers conduct data-driven studies more efficiently.